I had the pleasure of attending the latest Hackhathon and Gerrit User Summit in San Diego, at the beginning of October and I want to start by extending a thank you to GerritForge Inc. and Qualcomm for organizing it.
It’s been good to see new faces participating, particularly at the User Summit. The hackathon allowed us to explore different topics, from performance improvements to AI integration.
The main outcomes were the following:
JGit performance improvements: Multi-pack index (MIDX for short) is a feature already present in CGit, where it proved to bring a significant performance improvement in object lookup. We managed to implement a PoC in JGit for the MIDX loader and use it in the code. Some basic initial profiling provided a 63% improvement in performance on upload-pack! Not bad for a three-day work! Here is the list of JGit changes. Stay tuned for further development.
New AI model implementation: the existing ChatGPT plugin has been renamed and abstracted to accommodate other AI models (i.e. Llama).
Message of the day plugin: The Message of the Day plugin is a simple plugin for displaying messages to users, for example, during maintenance operations. Currently, the plugin requires configuration changes to set it up, which can be tedious for Gerrit admins daily. Some changes have been made to allow the plugin to be configured via the UI.
The user summit was rich of talks around version upgrades and Gerrit running in k8s, among other topics. Here is a quick summary of the talks, which will be published on GerritForge TV:
Version upgrades: Qualcomm proposed a talk describing their use case while migrating from 2.7 to 3.5 their high-availability installation. On the same note, we, as GerritForge, proposed a different approach to migrations, bringing a new pattern to the community to minimize disruptions, particularly when migrating many versions in one go. We described some use cases of customers we helped migrate on a project basis rather than a “big bang” approach.
K8s Gerrit: SAP described the now mature high-availability setup internally used running Gerrit on K8s, using the operator implemented in the k8s Gerrit project. We, as GerritForge, illustrated the changes we did to the same project to allow Gerrit to run in a multi-site fashion, leveraging a share-nothing architecture.
The expensive re-check button: research from the University of Waterloo presented by Prof. Shane Mcintosh illustrated the “hidden” costs behind the bad habit of a “simple” re-triggering of test suites because of non-deterministic test behaviors. The case study presented was on the OpenStack project.
What’s new in 3.11: Qualcomm presented interesting features and bug fixes for the soon-to-be-released Gerrit version.
Git repo maintenance made easy: SCMs are a mission-critical part of any software-related business. GerritForge talked about GHS, an AI-driven approach to maintaining the performance of busy Git repositories that undergo heavy workloads.
These and many other topics were discussed during the conference and unconference section of the user summit. This is it for now, but I am looking forward to the next User Summit to meet with the community and come up with new interesting discussions.
The Gerrit spring hackathon just ended on Discord, with GerritForge attending from London, SAP, Google from Germany, and WikiMedia from France). One of the PoC we have been working on is a prototype for a scalable and “intelligent” repository optimizer.
Git server implementation agnostic: we want the tool to be usable on any Git repository, not necessarily one managed by Gerrit Code Review
Modular: the different components of the tool must be independent and pluggable, giving a chance to integrate into already existing Git server Setups.
After a couple of whiteboard rounds, we developed the following components: Monitor, RuleEngine, and Optimizer.
Each is independent, highly configurable, and communicates with the other components via a message broker (AWS SQS). Following is a list of the responsibility of each of them:
Monitor: watch the filesystem and notify for activities happening in the git repository, i.e., increase/decrease of repository size
RuleEngine: listens for notifications from Monitor and decides whether any activity is needed on the repository, i.e., a git GC, a git repack, etc. The decision can be based not only on the repository parameters (number of loose objects, number of refs, etc.) but also, for example, on traffic patterns. If RuleEngine decides an optimization is needed, it will notify the Optimizer.
Optimizer: listen for instructions coming from the RuleEngine and execute them. This can be a git GC, a git repack, etc. It is not its call to decide which activity to carry on. However, it will determine if it is the right moment. For example, it will only run concurrent GCs or do any operation if there are enough resources.
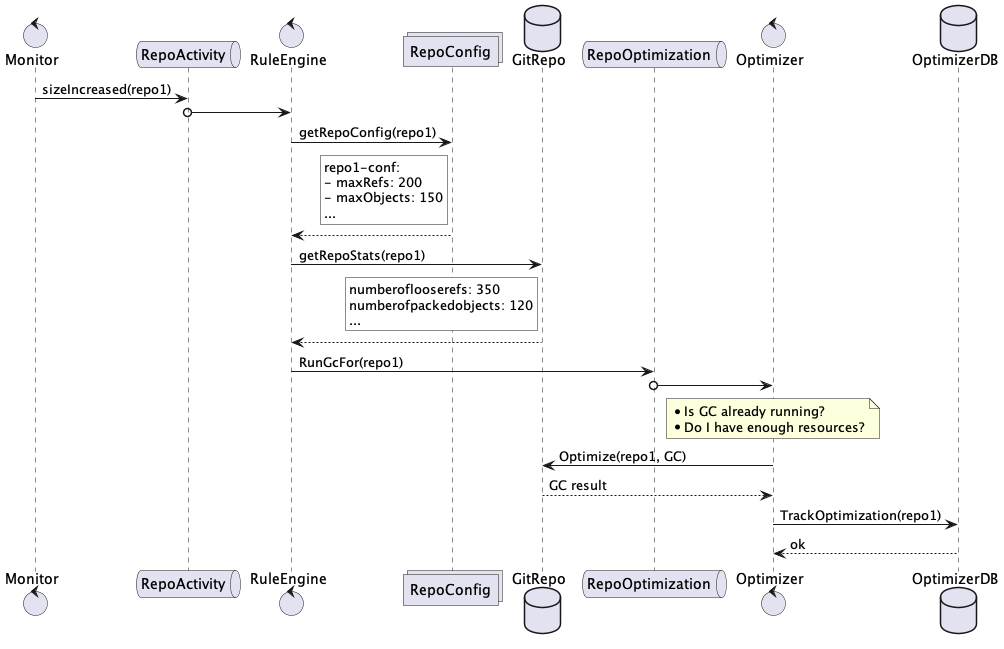
Following is an example of interaction among the components, where the decision to run a GC is based on some thresholds set in the repository configuration:
In the above example, Monitor reports an increase in the repository size and notifies the RuleEngine via the broker RepoActivity queue.
RuleEngine gets the repository configuration and decides a GC is needed since some thresholds were exceeded. It notifies the operation type and the repository to the Optimizer via the broker RepoIntervention queue.
Optimizer checks if there are other GC currently running and if there are enough resources and then runs the GC and keeps track of its result and timestamp.
As it is possible to see, we met the criteria we initially aimed for since:
None of the components needs or use Gerrit, even though the repository was hosted in a Gerrit Code Review setup
Components are independent and swappable. For example, if we used Gerrit, the RepoMonitor could be swapped with a plugin acting as a bridge between Gerrit stream events and the broker.
Lessons learned
Having low coupling among the different components will allow:
The user to pick only the components needed in their installation
The user to integrate the tool into a pre-existing infrastructure
The developers to potentially work with different technologies and different lifecycles
The user to pick only the components needed in their installation
SQS proved to be straightforward to work with during the prototyping phase, allowing to spin up the service locally with Docker quickly
Modeling the messages among the components is crucial and has to be carefully thought-out at the beginning
More planning needs to be spent in choosing the broker system; for example, handling non-processable messages and managing DLQs hasn’t been considered at all
Next steps
We are aiming to start working on an MVP as soon as possible. Maybe starting from one of the components and slowly adding the others.
As soon as we have an MVP, as usual, the code will be available; just waiting for contributions and feedback.
Traditionally, we will use gerrithub.io to dogfood it, and we will report back.
Git protocol v2 landed in Gerrit 3.1 on the 11th of October 2019. This is the last email from David Ostrovsky concluding a thread of discussion about it:
It is done now. Git wire protocol v2 is a part of open source Gerrit and will beshipped in upcoming Gerrit 3.1 release.
And, it is even enabled per default!
Huge thank to everyone who helped to make it a reality!
A big thanks to David and the whole community for the hard work in getting this done!
This was the 3rd attempt to get the feature in Gerrit after a couple of issues encountered along the path.
Why Git protocol v2?
The Git protocol v2 introduces a big optimization in the way client and server communicate during clones and fetches.
The big change has been the possibility of filtering server-side the refs not required by the client. In the previous version of the protocol, whenever a client was issuing a fetch, all the references were sent from the server to the client, even if the client was fetching a single ref!
In Gerrit this issue was even more evident, since, as you might know, Gerrit leverages a lot the refs for its internal functionality, even more with the introduction of NoteDb.
Whenever you are creating a Change in Gerrit you are updating/creating at least 3 refs:
refs/changes/NN/<change-num>/<patch-set>
refs/changes/NN/<change-num>/meta
refs/sequences/changes
In the Gerrit project itself, there are currently about 104K refs/change and 24K refs/change/*/meta. Imagine you are updating a repo which is behind just a couple of commits, you will get all those references which will take up most of your bandwidth.
Git protocol v2 will avoid this, just sending you back the references that the Git client requested.
Is it really faster?
Let’s see if it really does what is written on the tin. We have enabled Gerrit v2 at the end of 2019 on GerritHub.io, so let’s test it there. You will need a Git client from version 2.18 onwards.
As you can see there is a massive difference in the data sent back on the wire!
How to enable it?
If you want to enable it, you just need to update you git config (etc/jgit.config in 3.1 and $HOME/.gitconfig in previous versions) with the protocol version to enable it and restart your server:
[protocol]
  version = 2
Enjoy your new blazing fast protocol!
If you are interested in more details about the Git v2 protocol you can find the specs here.
We have already discussed in previous posts how important it is to speedup the feedback loop in your Software Development Lifecycle. Having early feedbacks gives you the chance of evaluating your hypothesis and eventually change direction if needed.
The more information you have, the smarter can be your decisions.
We recently added in our Gerrit DevOps Analytics the possibility of extracting data coming from Code Reviews’ metadata to extend the knowledge we can get out of Gerrit.
Furthermore, it is possible to extract meta-data from repositories not necessarily hosted on the Gerrit instance running the analytics processing. This is a big improvement since it allows to fully analyse repositories coming from any Gerrit server.
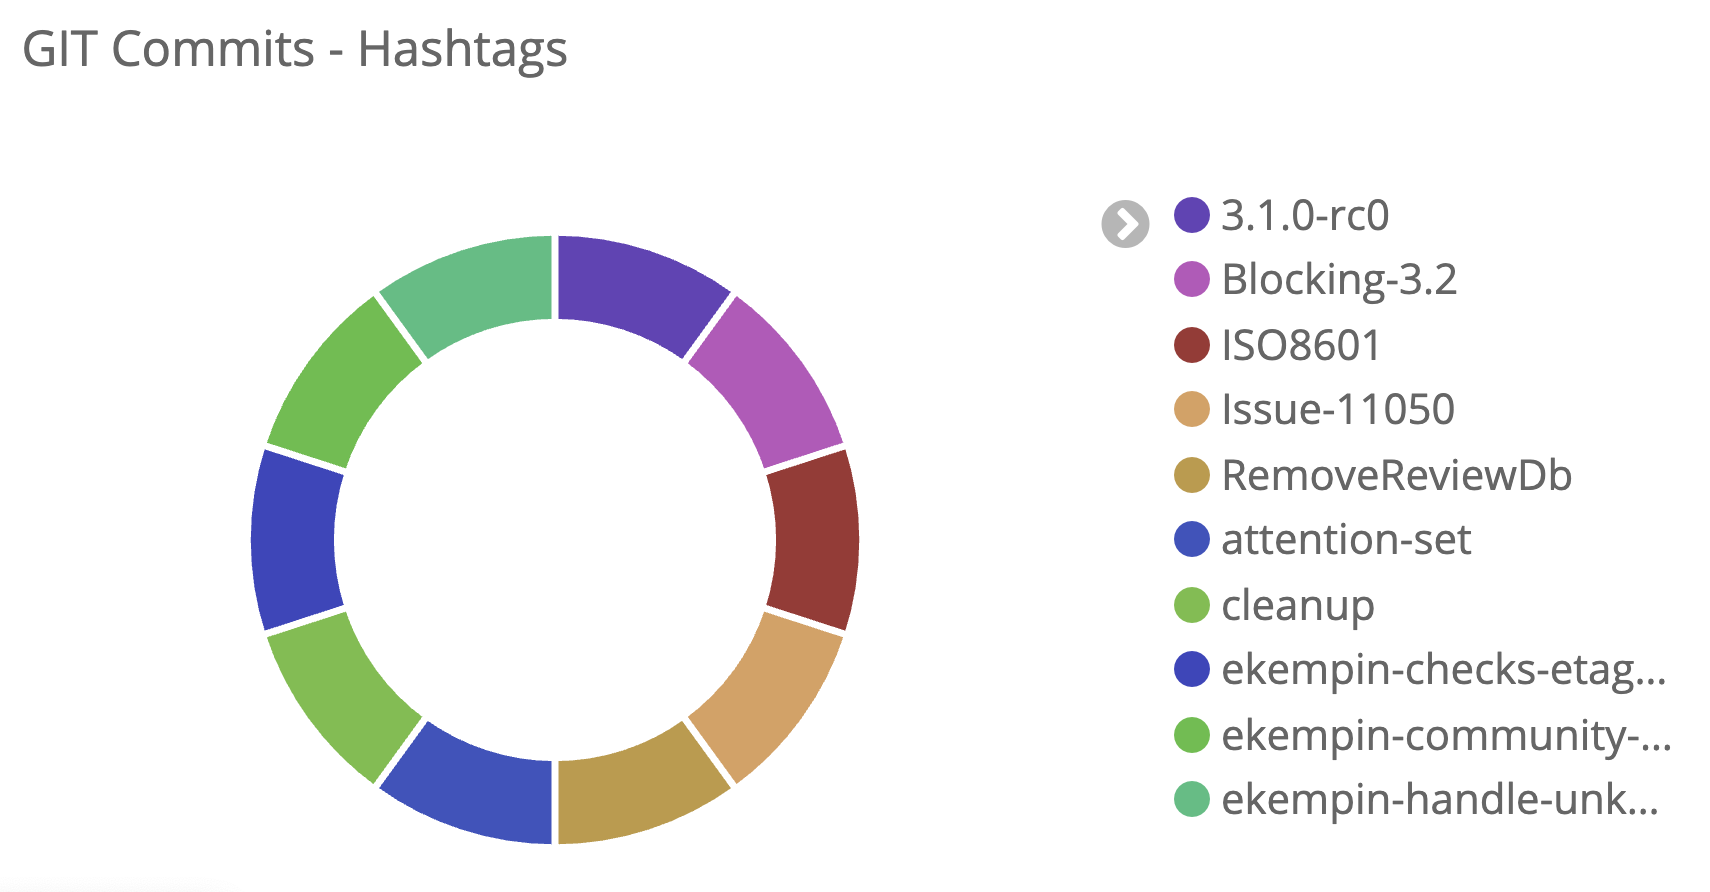
One important type of meta-data contained in the Code Reviews is the hashtag.
Hashtags are freeform strings associated with a change, like on social media platforms. In Gerrit, you explicitly associate hashtags with changes using a dedicated area of the UI; they are not parsed from commit messages or comments.
Similar to topics, hashtags can be used to group related changes together and to search using the hashtag: operator. Unlike topics, a change can have multiple hashtags, and they are only used for informational grouping; changes with the same hashtags are not necessarily submitted together.
You can use them, for example, to mark and easily search all the changes blocking a particular release:
Hashtags can also be used to aggregate all the changes people have been working on during a particular event, for example, the Gerrit User Summit 2019 hackathon:
The latest version of the Gerrit Analytics plugin exposes the hashtags attached to their respecting Git commit data. Let’s explore together some use cases:
The most popular Gerrit Code Review hashtags over the last 12 months
Throughput of changes created during an event
see for example the Palo alto hackathon (#palo-alto-2018). We can see at the end of the week the spike of changes to release Gerrit 2.16.
The extend of time for a feature
Removing GWT was an extensive effort which started in 2017 and ended in 2019. It took several hackathons to tackle the removal as shown by the hashtags distribution. Some changes were started in one hackathon and finalised in the next one.
Those were some example of useful information on how to leverage the power of GDA.
The above examples are taken from the GDA dashboardprovided and hosted by GerritForge on https://analytics.gerrithub.io which mirror commits and reviews on a regular basis from the Gerrit project and its plugin ecosystem.
How to setup GDA on Gerrit
Hashtag extraction is currently available from Gerrit 3.1 onwards. You can download the latest version released from the Gerrit CI.
To enable hashtag extraction you need to enable the feature extraction in the plugin config file as follow:
For more information on how to configure and run the plugin, look at the analytics plugin documentation.
Conclusion
Data is the goldmine of your company. You need more and more of it for making smarter decision. The latest version of the GDA allows you to leverage even more data produced during the code review process.
You can explore the potential of the information held in Gerrit on the analytics dashboard provided by GerritForge on analytics.gerrithub.io.
As a Gerrit administrator, making sure there is no performance impact while upgrading from one version to another can be difficult.
It is essential to:
have a smooth and maintainable way to reproduce traffic profiles to stress your server
easily interpret the results of your tests
Tools like wrk and ab are simple and good to run simple benchmarking tests, but when it comes to more complex scenarios and collection of client-side metrics, they are not the best tools to use.
Furthermore, they only support Close Workload Models, which might not always fit the behaviour of your system.
For those reasons in GerritForge we started to look at more sophisticated tools, and we started adopting Gatling, an open-source load testing framework.
The tool
The Gatling homepage describes it this way:
“Gatling is a highly capable load testing tool. It is designed for ease of use, maintainability and high performance…
Out of the box, Gatling comes with excellent support of the HTTP protocol…..
As the core engine is actually protocol-agnostic, it is perfectly possible to implement support for other protocols…
Based on an expressive DSL, the scenarios are self-explanatory. They are easy to maintain and can be kept in a version control system…” In this article, we focus on the maintainability and protocol agnosticism of the tool.
What about Git?
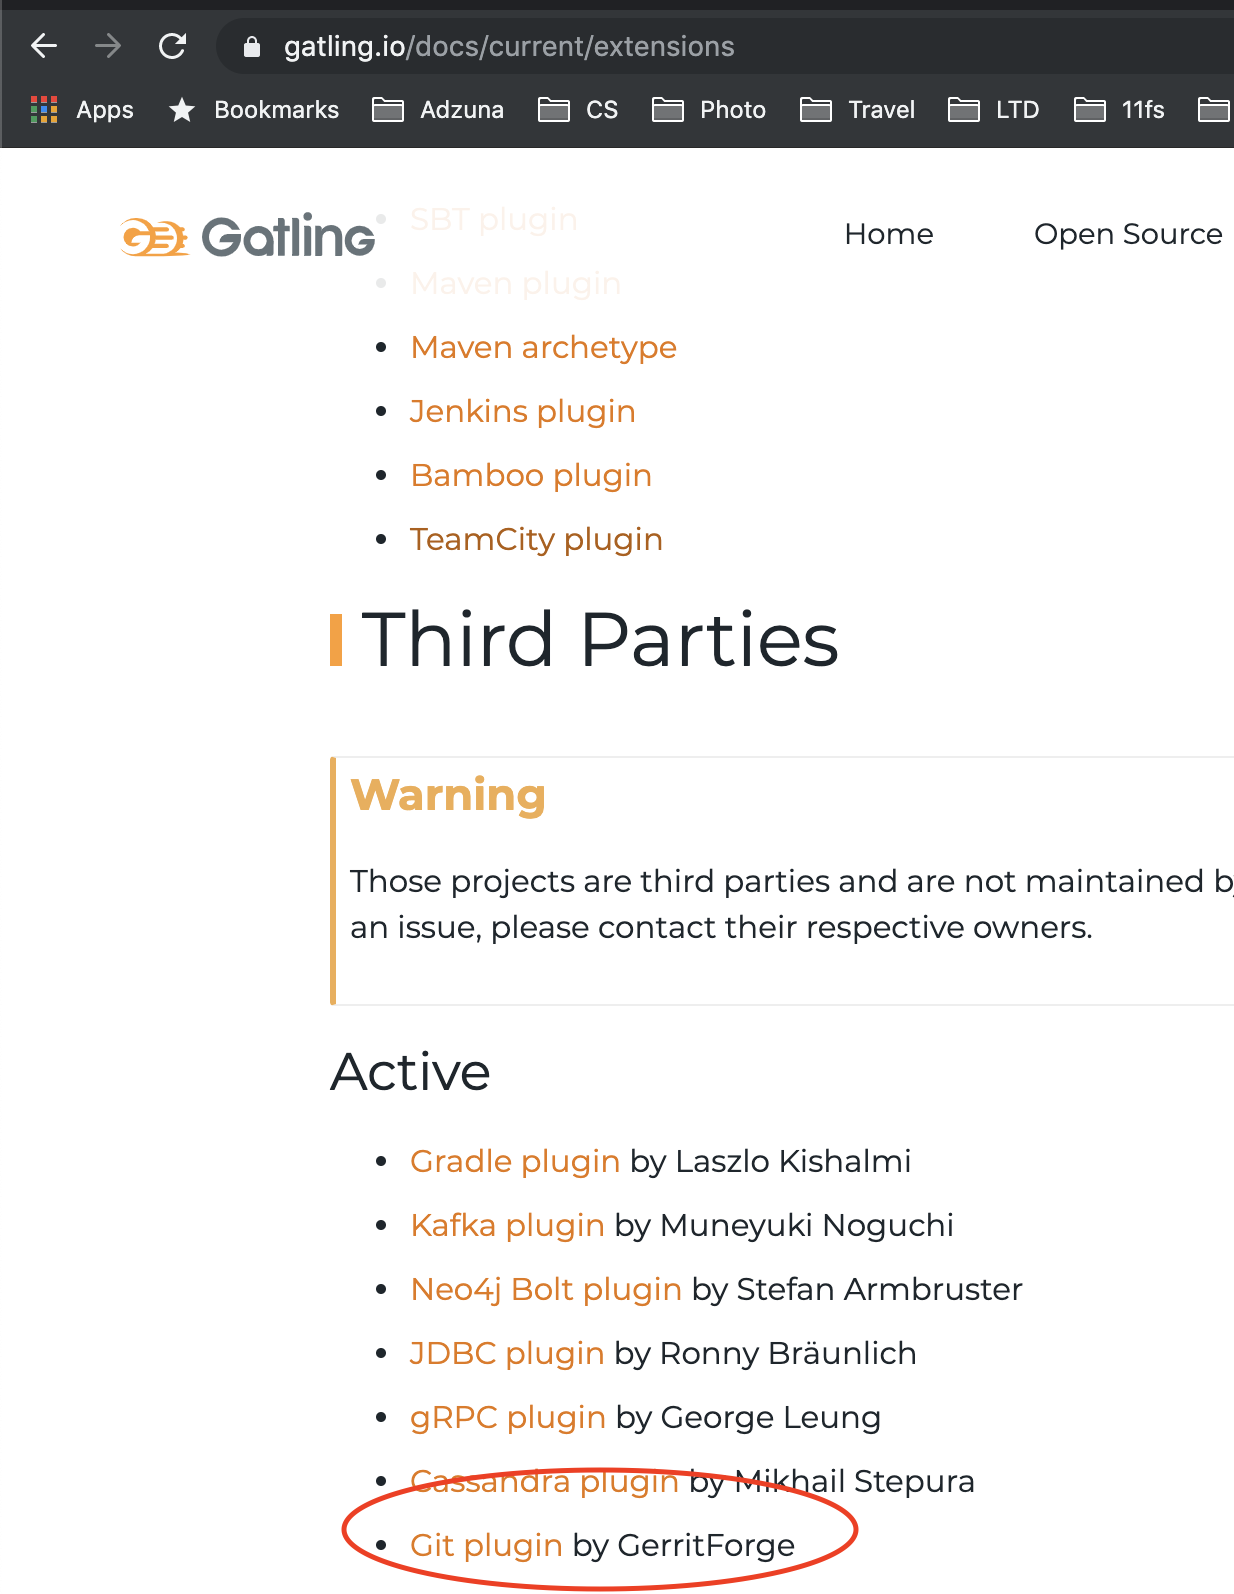
Gatling natively supports HTTP protocol, but since the core engine is protocol-agnostic, it was easy to write an extension to implement the Git protocol. I started working on the Gatling git extension in August during a Gerrit hackathon in Sweden, and I am happy to see that is starting to get traction in the community.
This way we ended up among the official Gatling extension on the official Gatling homepage:
The code of the git extension if opensource and free to use. It can be found here, and the library can be downloaded from Maven central. In case you want to raise a bug, you can do it here.
Maintainability
Gatling is written in Scala, and it expects the load tests scenarios to be written in Scala. Don’t be scared; there is no need to learn crazy functional programming paradigms, the Gatling DSL does a good job in abstracting the underneath framework. To write a scenario you just have to learn the building blocks made available by the DSL.
Here a couple of snippets extracted from a scenario to understand the DSL is:
class ReplayRecordsFromFeederScenario extends Simulation {
  // Boireplate to select the protocol and import the configuration
  val gitProtocol = GitProtocol()
  implicit val conf = GatlingGitConfiguration()

  // Feeder definition: the data used for the scenario will be loaded from "data/requests.json"
  val feeder = jsonFile("data/requests.json").circular

  // Scenario definition:
  val replayCallsScenario: ScenarioBuilder =
    scenario("Git commands") // What's the scenario's name?
      .forever {  // How many time do I need to run though the feed?
        feed(feeder) // Where shall I get my data?
          .exec(new GitRequestBuilder(GitRequestSession("${cmd}", "${url}"))) // Build a Git request
      }

  setUp(
    replayCallsScenario.inject(
      // Traffic shape definition....pretty self explanatory
      nothingFor(4 seconds),
      atOnceUsers(10),
      rampUsers(10) during (5 seconds),
      constantUsersPerSec(20) during (15 seconds),
      constantUsersPerSec(20) during (15 seconds) randomized
    ))
    .protocols(gitProtocol) // Which protocol should I use?
    .maxDuration(60 seconds) // How long should I run the scenario for?
}
Here another example reproducing the creation of a WIP change using the REST API:
class WIPWorkflow extends Simulation {

  // Configuration bolierplate
  implicit val conf: GatlingGitConfiguration = GatlingGitConfiguration()
  val baseUrl = "https://review.gerrithub.io"
  val username: String = conf.httpConfiguration.userName
  val password: String = conf.httpConfiguration.password
  val httpProtocol: HttpProtocolBuilder = http
    .baseUrl(baseUrl)
    .userAgentHeader("Gatling test")
  val request_headers: Map[String, String] = Map(
    "Content-Type" -> "application/json"
  )

  val scn = scenario("WIP Workflow") // What's the name of my scenario?
    .exec(
      http("Create WIP change")
        .post("/a/changes/") // Which url and which HTTP verb should I use?
        .headers(request_headers)
        .basicAuth(username, password) // How do I authenticate?
        .body( // What's the body of my request?
          StringBody("""{
            "project" : "GerritForge/sandbox/e2e-tests",
            "subject" : "Let's test this Gerrit! Create WIP changes!",
            "branch" : "master",
            "work_in_progress": "true",
            "status" : "NEW"
          }""")
        )
        .check(status.is(201)) // What's the response code I expect?
    )

  setUp(scn.inject(
    atOnceUsers(1) // Traffic profile
  )
  ).protocols(httpProtocol)
}
Jenkins integration
Running load tests can be tedious and time-consuming, but yet essential to spot any possible performance regression in your application.
Providing the least possible friction is essential to incentivize people in running them. If you are already using Jenkins in your company, you can leverage the Gatling plugin to scale your load quickly and provide easy access to metrics.
A real use case: Gerrit v3.0 Vs Gerrit v3.1 load test…in production!
Let’s go through a real case scenario to show how useful and easy to read are the metrics provided by Gatling.
The closest environment to your production one is…production!
gerrithub.io runs Gerrit in a multi-site configuration, and this gives us the luxury of doing canary releases, only upgrading a subset of the master nodes running Gerrit. One of the significant advantages is that we can run A/B tests in production.
That allows us also to run meaningful load tests against the production environment. See below a simplified picture of our Gerrit setup where it is possible to see the canary server with a higher Gerrit version.
We ran against 2 servers in Germany the same load tests which:
Create 100 chained Change Sets via REST API
Submit all the changes together via REST API
We then compared the server-side and client-side metrics to see if a good job has been done with the latest Gerrit version.
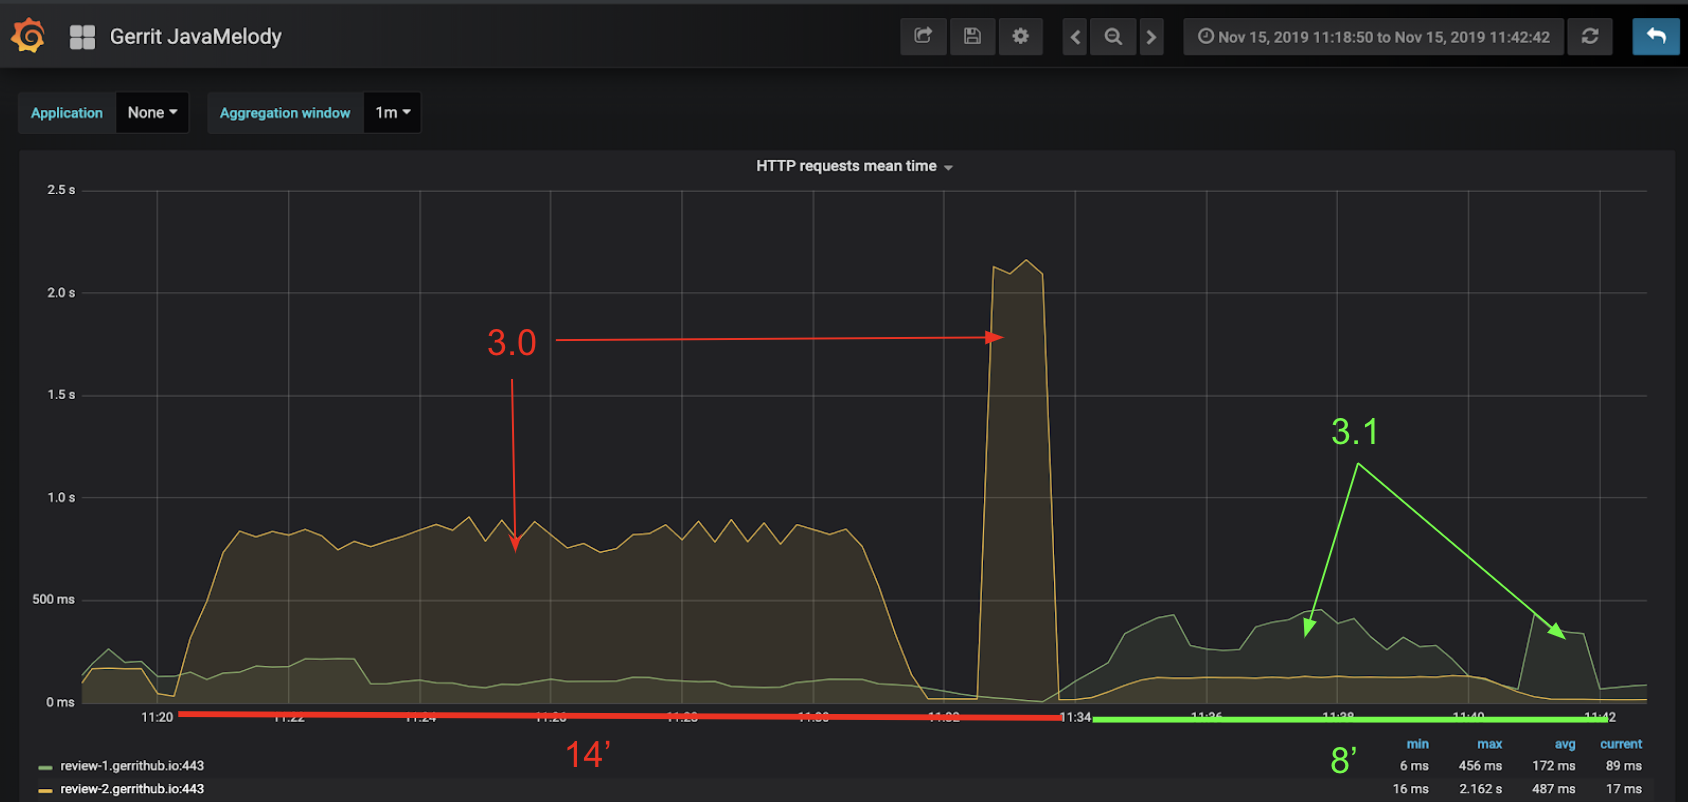
Server-side metrics
Server-side metrics come from the Prometheus exporter plugin. The image is showing the HTTP requests mean time:
We can see the improvement in the latest Gerrit version. The mean requests time is almost halved and, of course, the overall duration is decreased.
Client-side metrics
Let’s see what is going on on the client-side using the metrics provided by Gatling.
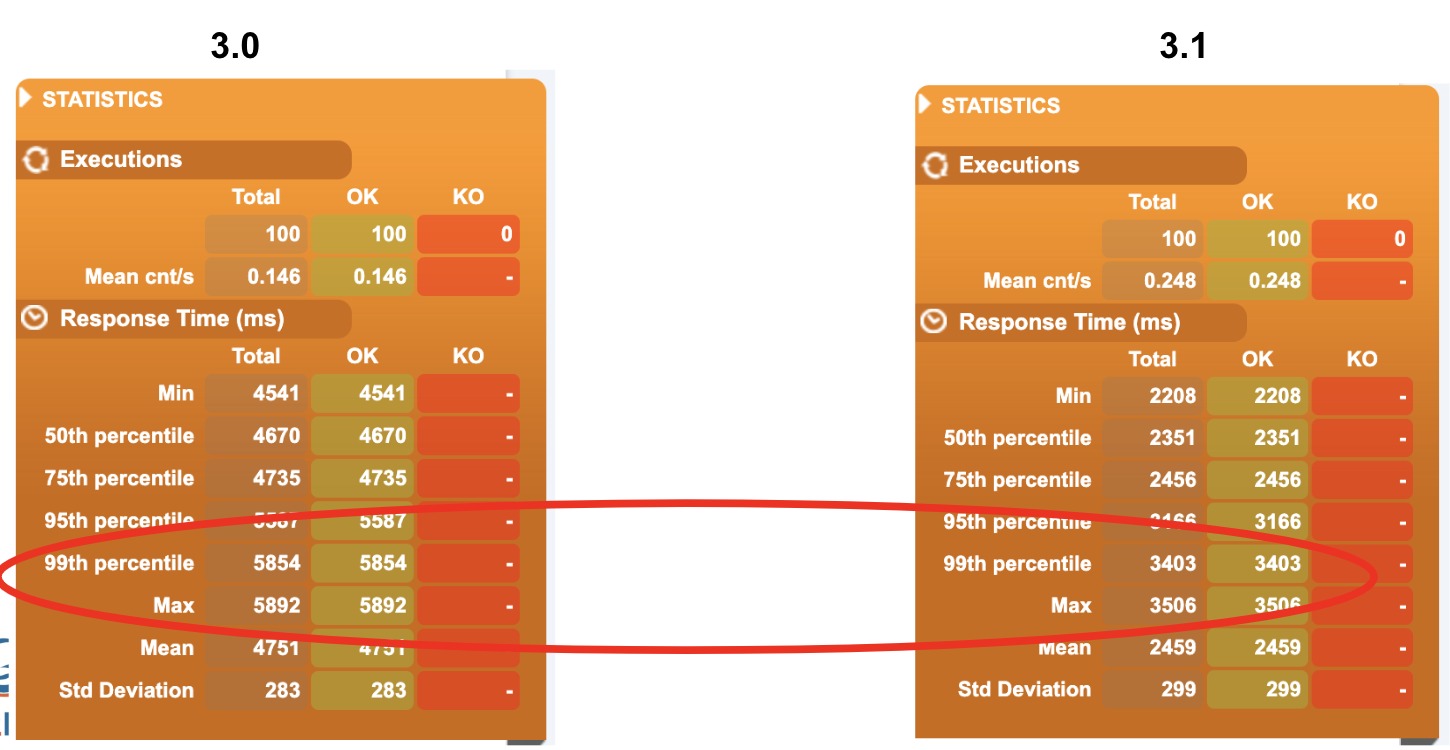
Among all the metrics we are going to focus on one step of the test, since we have more data points about it, the creation of the change:
We can already see from the overall report the reduction of the response time in the latest Gerrit version:
If we look in-depth to all the response times, we can see that the distribution of the response times is pretty much the same, but the scale is different….again we confirmed the result we previously encountered.
What can we say…Good job Gerrit community!
Wrapping up
(You can see my presentation about Gatling in the last Gerrit User summit in Sunnyvale here <- add this when the talk will be sharable)
I have touched superficially several topics in this blog posts:
simplicity and maintainability provided by the Gatling DSL
Integration with Jenkins
Gatling extensions and reuse of the statistic engine
Example scenarios
I would like to write more in-depth about all these topics in some follow-up blog posts. Feel free to vote for the topic you are more interested in or suggest new ones in the comments section of this post.
If you need any help in setting up your scenario or understand how to run load tests against your Gerrit installation effectively, GerritForge can help you.
Jenkins and Gerrit are the most critical components of the DevOps Pipeline because of their focus on people (the developers), their code and collaboration (the code review) their builds and tests (the Jenkinsfile pipeline) that produce the value stream to the end user.
DevOps is all about iteration and fast feedback. That can be achieved by automating the build and verification of the code changes into a target environment, by allowing all the stakeholder to have early access to what the feature will look like and validating the results with speed and quality at the same time.
Every development team wants to make the cycle time smaller and spend less time in tedious work by automating it as much as possible. That trend has created a new explosion of fully automated processes called “Bots” that are more and more responsible for performing those tasks that developers are not interested in doing manually over and over again.
As a result, developers are doing more creative and design work, are more motivated and productive, can address technical debt a lot sooner and allow the business to go faster in more innovative directions.
As more and more companies are adopting DevOps, it becomes more important to be better and faster than your competitors. The most effective way to accelerate is to extract your data, understand where your bottlenecks are, experiment changes and measure progress.
Humans vs. Bots
The Gerrit Code Review project is fully based on an automated DevOps pipeline using Jenkins. We collect the data produced during the development and testing of the platform and extract metrics and graphs around it constantly https://analytics.gerrithub.io thanks to the OpenSource solution Gerrit DevOps Analytics (aka GDA).
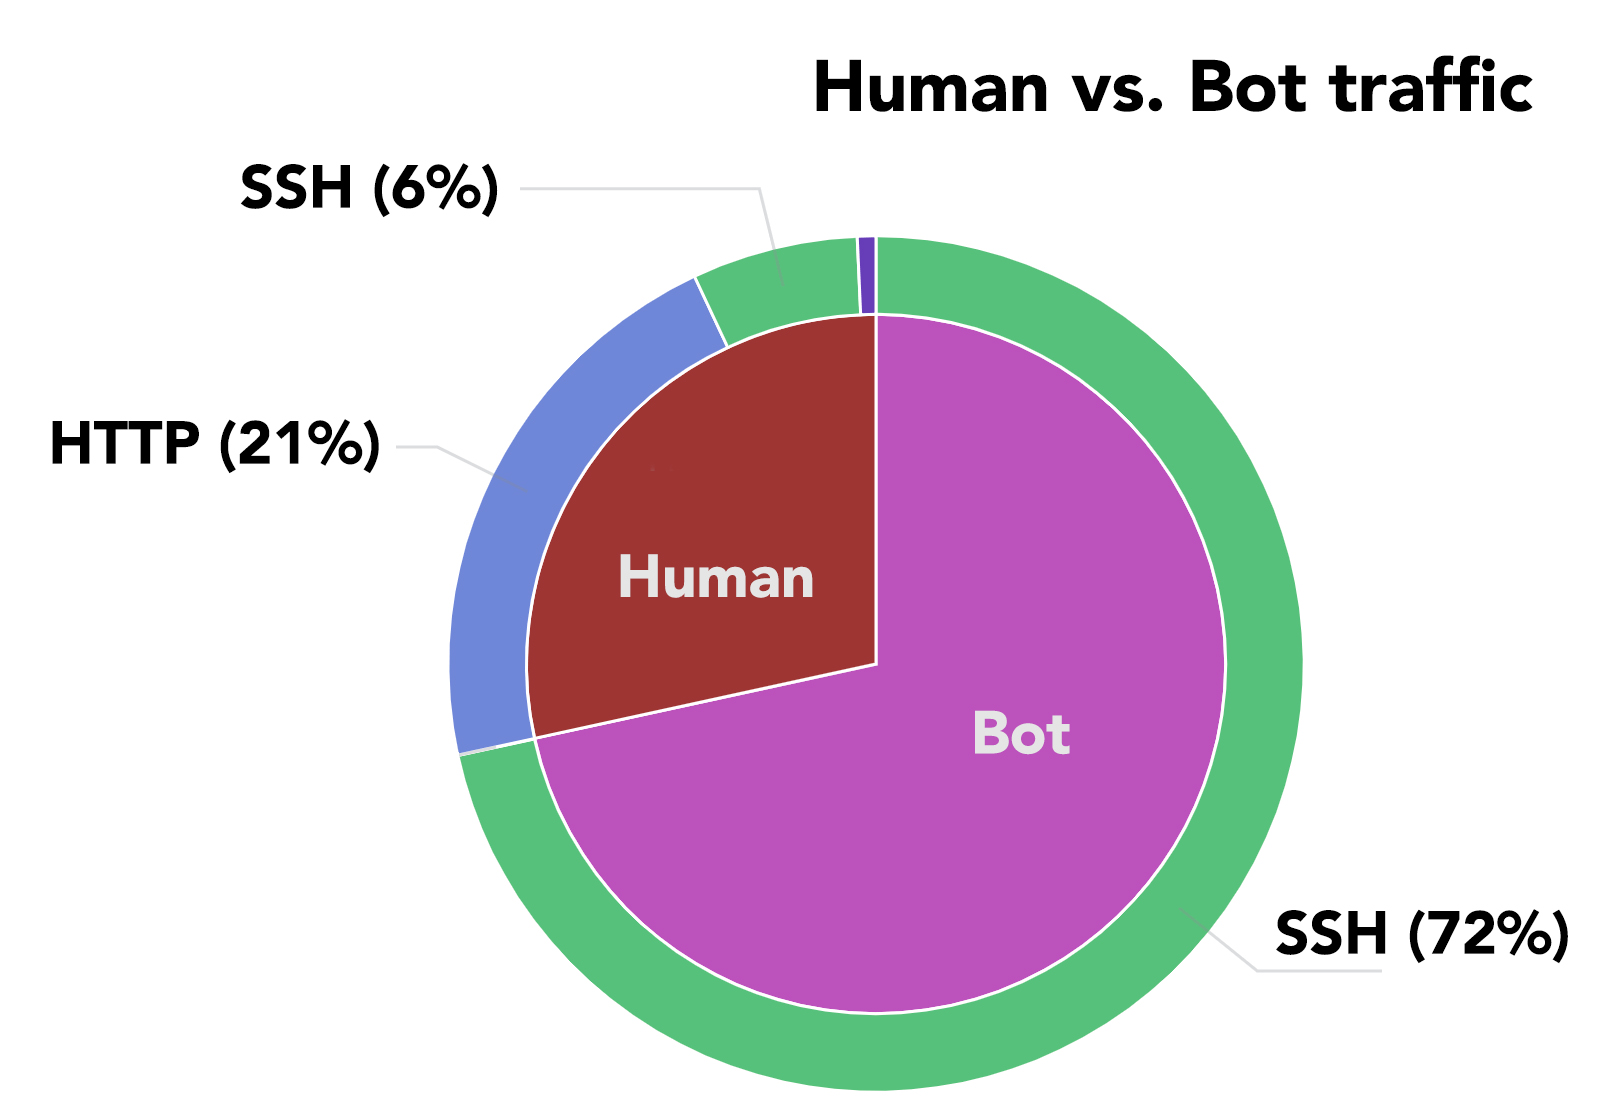
By looking at the protocol and code statistics, we founded out that bots are much more hard worker than humans on GerritHub.io, which hosts, apart from the Gerrit Code Review mirrored projects, also many other popular OpenSource.
That should not come as a surprise if you think of how many activities could potentially happen whenever a PatchSet is submitted in Gerrit: style checking, static code analysis, unit and integration testing, etc.
We also noticed that most of the activities of the bots are over SSH. We started to analyze what the Bots are doing and see what the impact is on our service and possibly see if there are any improvements we can do.
Build integration, the wrong way
GerritHub has an active site with multiple nodes serving read/write traffic and a disaster recovery site ready to take over whenever the active one has any problem.
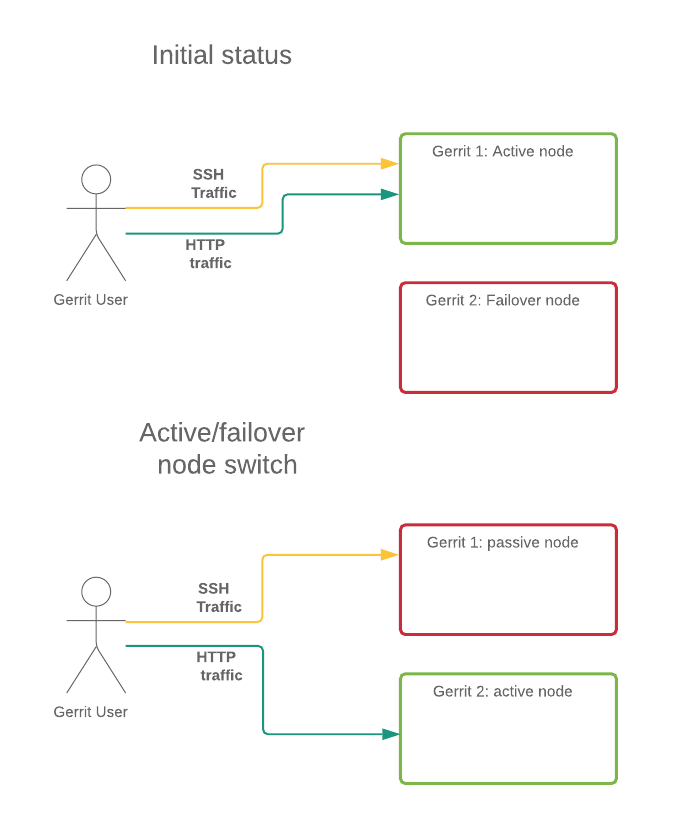
Whenever we roll out a new version of Gerrit, using the so-called ping-pong technique, we swap the roles of the two sites (see here for more details). Within the same site, also, the traffic can jump from one to the other in the same cluster using active failover, based on health, load and availability. The issue is that we end up in a situation like the following:
The “old” instance still served SSH traffic after the switch. We noticed we had loads of long-lived SSH connections. These are mostly integration tools keeping SSH connections open listening to Gerrit events.
Long-lived SSH connections have several issues:
SSH traffic doesn’t allow smart routing. Hence we end up with HTTP traffic going on the currently active node and most of the SSH one still on the old one
There is no resource pooling since the connections are not released
There is the potential loss of events when restarting the connections
That impacts the overall stability of the software delivery lifecycle, extending the feedback loop and slowing your DevOps pipeline down.
Then we started to drill down into the stateful connections to understand why they exist, where are they coming from and, most importantly, which part of the pipeline they belong to.
Jenkins Integration use-case
The Gerrit Trigger plugin for Jenkins is one of the integration tools that has historically been suffering from those problems, and unfortunately, the initial tight integration has become over the years less effective, slow and complex to use.
There are mainly two options to integrate Jenkins with Gerrit:
We use both of them with the Gerrit Code Review project, and we have put together a summary of how they compare to each other:
Gerrit Trigger Plugin
Gerrit Code review Plugin
Notes
Trigger mechanism
Stateful
Jenkins listens for Gerrit events stream
Stateless
Gerrit webhooks notify events to Jenkins
Stateful stream events are consuming resources on both Jenkins and Gerrit
Transport Protocol
SSH session on a long-lived stream events connection
HTTP calls for each individual stream event
– SSH cannot be load-balanced
– SSH connections cannot be pooled or reused
Setup Complexity
Hard: requires a node-level and project-level configuration.
No native Jenkinsfile pipeline integration
Easy: no special knowledge required.
Integrates natively with Jenkinsfile and multi-branch pipeline
Configuring the Gerrit Trigger Plugin is more error-prone because requires a lot of parameters and settings.
Systems dependencies
Tightly Coupled with Gerrit versions and plugins.
Uses Gerrit as a generic Git server, loosely coupled.
Upgrade of Gerrit might break the Gerrit Trigger Plugin integration.
Gerrit knowledge
Admin: You need to know a lot of Gerrit-specific settings to integrate with Jenkins.
User. You only need to know Gerrit clone URL and credentials.
The Gerrit Trigger plugin requires special user and permissions to listen to Gerrit stream events.
Fault tolerance to Jenkins restart
Missed events: unless you install a server-side DB to capture and replay the events.
Transparent: all events are sent as soon as Jenkins is back.
Gerrit webhook automatically tracks and retries events transparently.
Tolerance to Gerrit rolling restart
Events stuck: Gerrit events are stuck until the connection is reset.
Transparent: any of the Gerrit nodes active continue to send events.
Gerrit trigger plugin is forced to terminate stream with a watchdog, but will still miss events.
Differentiate actions per stage
No flexibility to tailor the Gerrit labels to each stage of the Jenkinsfile pipeline.
Full availability to Gerrit labels and comments in the Jenkinsfile pipeline
Multi-branch support
Custom: you need to use the Gerrit Trigger Plugin environment variables to checkout the right branch.
Native: integrates with the multi-branch projects and Jenkinsfile pipelines, without having to setup anything special.
Gerrit and Jenkins friends again
After so many years of adoption, evolution and also struggles of using them together, finally Gerrit Code Review has the first-class integration with Jenkins, liberating the Development Team from the tedious configuration and BAU management of triggering a build from a change under review.
Jenkins users truly love using Gerrit and the other way around, friends and productive together, again.
Conclusion
Thanks to Gerrit DevOps Analytics (GDA) we managed to find one of the bottlenecks of the Gerrit DevOps Pipeline and making changes to make it faster, more effective and reliable than ever before.
In this case, by just picking the right Jenkins integration plugin, your Gerrit Code Review Master Server would run faster, with less resource utilization. Your Jenkins pipeline is going to be simpler and more reliable with the validation of each change under review, without delays or hiccups.
The Gerrit Code Review plugin for Jenkins is definitively the first-class integration to Gerrit. Give it a try yourself, you won’t believe how easy it is to set up.
Accelerating your time to market while delivering high-quality products is vital for any company of any size. This fast pacing and always evolving world relies on getting quicker and better in the production pipeline of the products. The whole DevOps and Lean methodologies help to achieve the speed and quality needed by continuously improving the process in a so-called feedback loop. The faster the cycle, the quicker is the ability to achieve the competitive advantage to outperform and beat the competition.
It is fundamental to have a scientific approach and put metrics in place to measure and monitor the progress of the different actors in the whole software lifecycle and delivery pipeline.
Gerrit DevOps Analytics (GDA) to the rescue
We need data to build metrics to design our continuous improvement lifecycle around it. We need to juice information from all the components we use, directly or indirectly, on a daily basis:
SCM/VCS (Source and Configuration Management, Version Control System) how many commits are going through the pipeline?
Code Review
what’s the lead time for a piece of code to get validated?
How are people interacting and cooperating around the code?
Issue tracker (e.g. Jira)
how long does it take the end-to-end lifecycle outside the development, from idea to production?
Getting logs from these sources and understanding what they are telling us is fundamental to anticipate delays in deliveries, evaluate the risk of a product release and make changes in the organization to accelerate the teams’ productivity. That is not an easy task.
Gerrit DevOps Analytics (aka GDA) is an OpenSource solution for collecting data, aggregating them based on different dimensions and expose meaningful metrics in a timely fashion.
GDA is part of the Gerrit Code Review ecosystem and has been presented during the last Gerrit User Summit 2018 at Cloudera HQ in Palo Alto. However, GDA is not limited to Gerrit and is aiming at integrating and processing any information coming from other version control and code-review systems, including GitLab, GitHub and BitBucket.
Case study: GDA applied to the Gerrit Code Review project
One of the golden rules of Lean and DevOps is continuous improvement: “eating your dog food” is the perfect way to measure the progress of the solution by using its outcome in our daily life of developing GDA.
As part of the Gerrit project, I have been working with GerritForge to create Open Source tools to develop the GDA dashboards. These are based on events coming from Gerrit and Git, but we also extract data coming from the CI system, the Issue tracker. These tools include the ETL, for the data extraction and the presentation of the data.
As you will see in the examples Gerrit is not just the code review tool itself, but also its plugins ecosystem, hence you might want to include them as well into any collection and processing of analytics data.
Wanna try GDA? You are just one click away.
We made the GDA more accessible to everybody, so more people can play with it and understand its potentials. We create the Gerrit Analytics Wizardplugin so you can have some insights in your data with just one click.
What you can do
With the Gerrit Analytics Wizard you can get started quickly and with only one click you can get:
Initial setup with an Analytics playground with some defaults charts
Populate the Dashboard with data coming from one or more projects of your choice
The full GDA experience
When using the full GDA experience, you have the full control of your data:
Schedule recurring data imports. It is just meant to run a one-off import of the data
Create a production ready environment. It is meant to build a playground to explore the potentials of GDA
You can find here more detailed information about the installation.
One click to crunch loads of data
Once you have Gerrit and the GDA Analytics and Wizard plugins installed, chose the top menu item Analytics Wizard > Configure Dashboard.
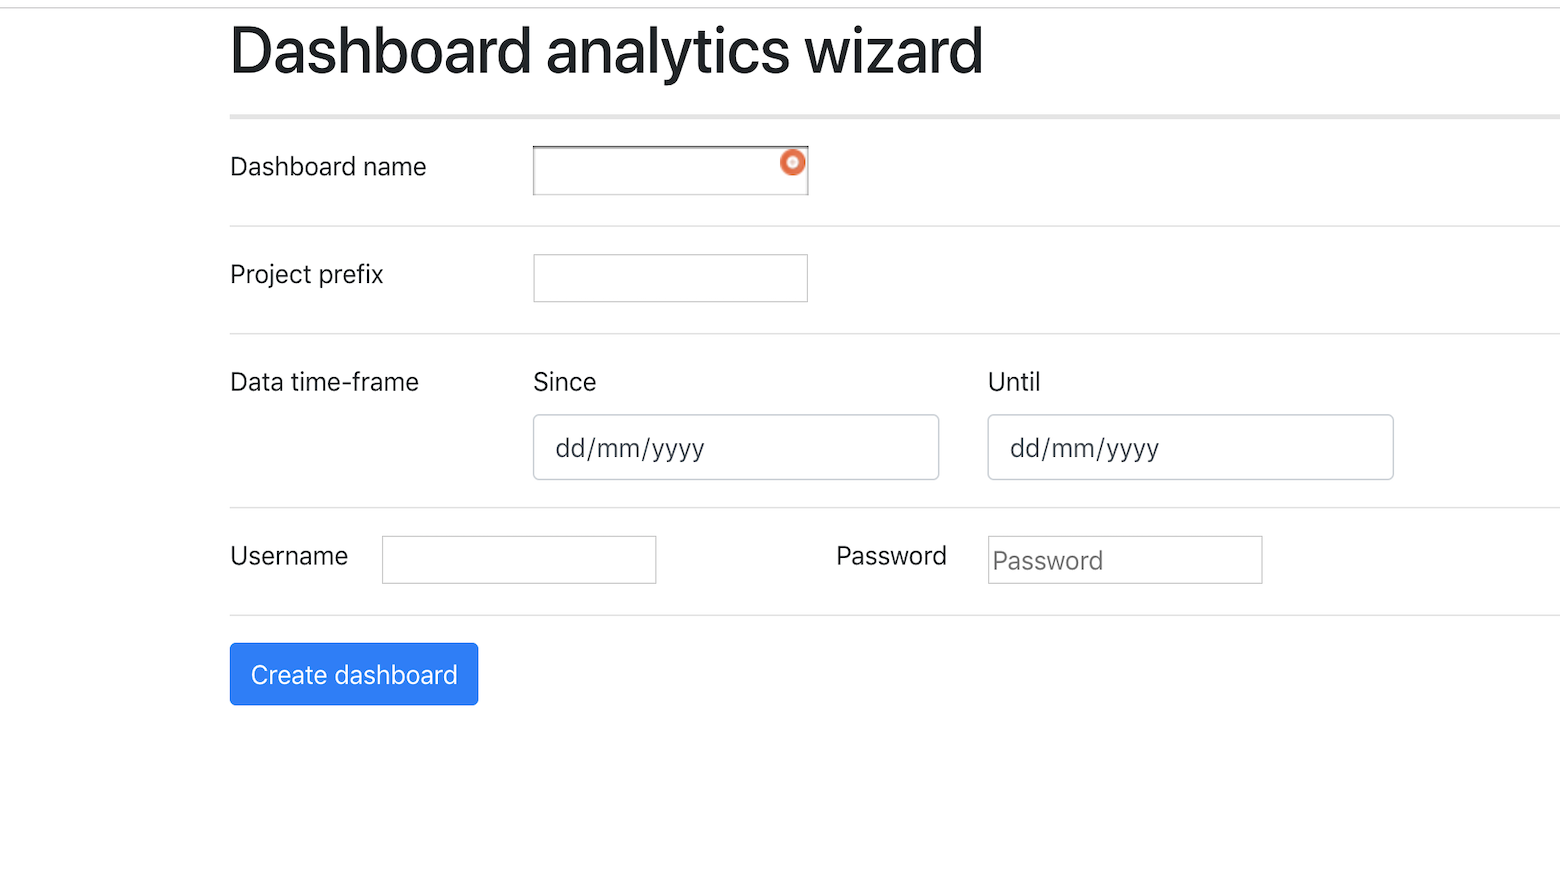
You land on the Analytics Wizard and can configure the following parameters:
Dashboard name (mandatory): name of the dashboard to create
Projects prefix (optional): prefix of the projects to import, i.e.: “gerrit” will match all the projects that are starting with the prefix “gerrit”. NOTE: The prefix does not support wildcards or regular expressions.
Date time-frame (optional): date and time interval of the data to import. If not specified the whole history will be imported without restrictions of date or time.
Username/Password (optional): credentials for Gerrit API, if basic auth is needed to access the project’s data.
Sample dashboard analytics wizard page:
Once you are done with the configuration, press the “Create Dashboard” button and wait for the Dashboard, tailored to your data, to be created (beware this operation will take a while since it requires to download several Docker images and run an ETL job to collect and aggregate the data).
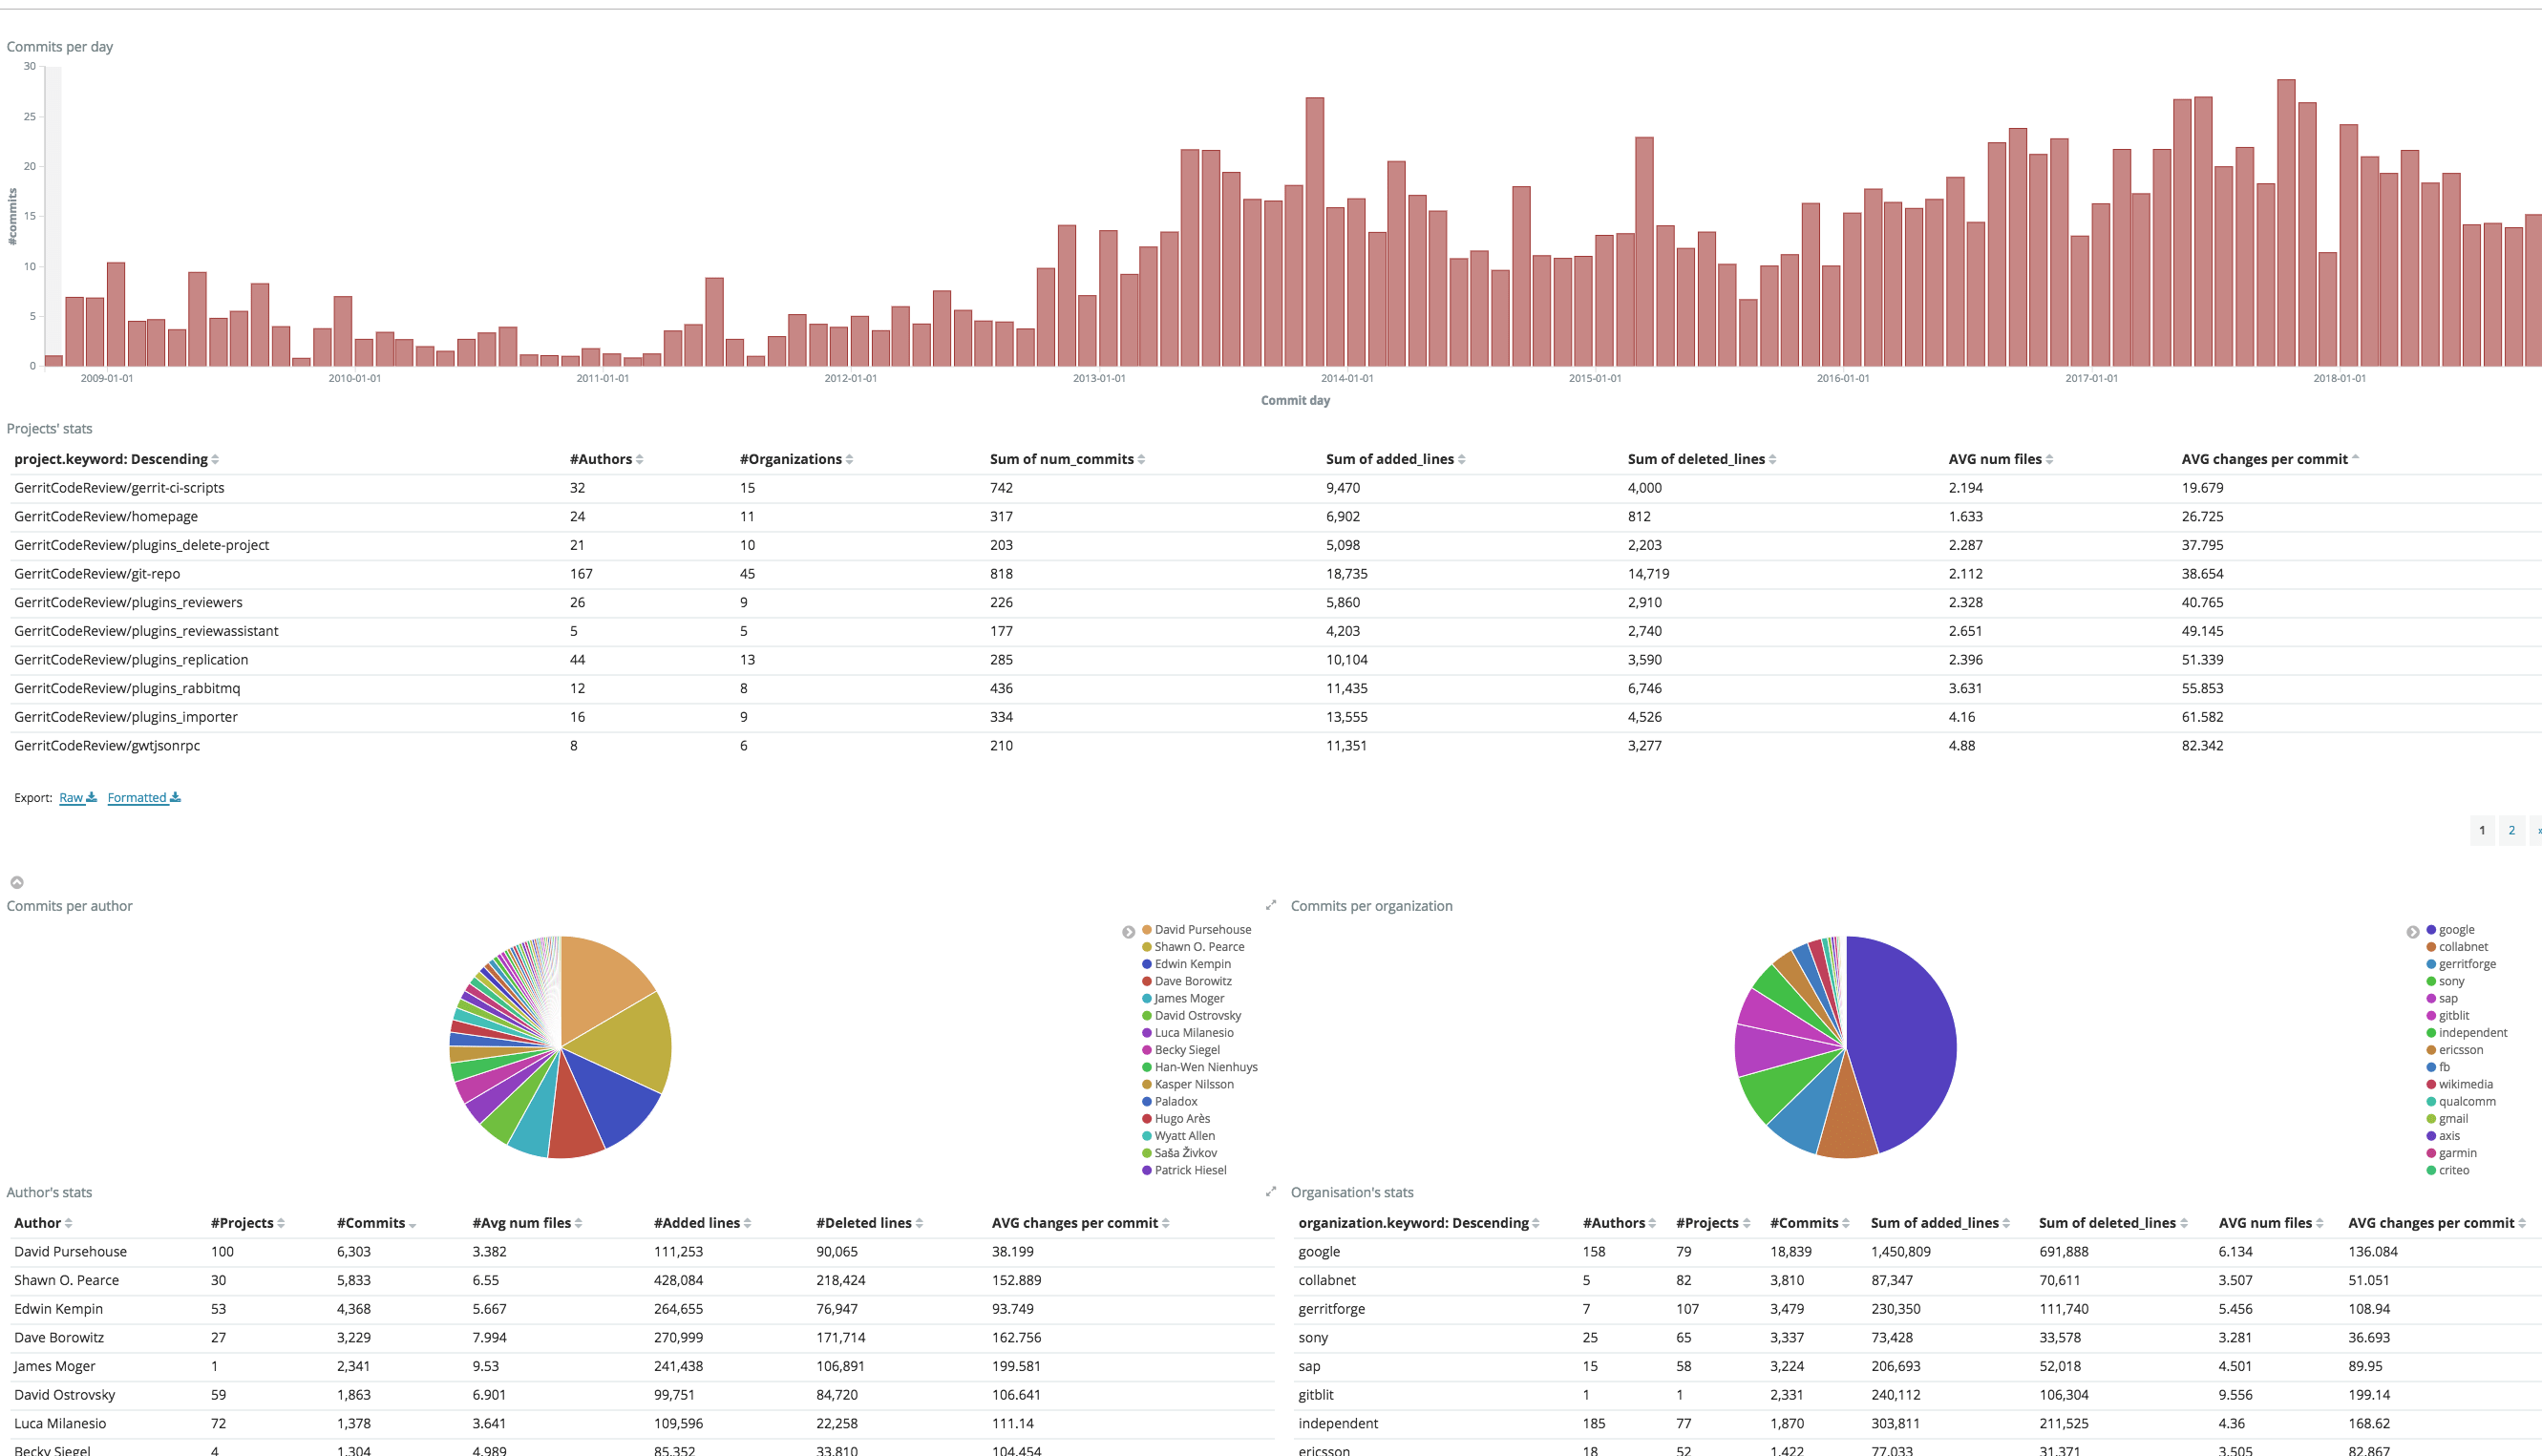
At the end of the data crunching you will be presented with a Dashboard with some initial Analytics graphs like the one below:
You can now navigate among the different charts from different dimensions, through time, projects, people and Teams, uncovering the potentials of your data thanks to GDA!
What has just happened behind the scenes?
When you press the “Create Dashboard” button, loads of magic happens behind the scenes. Several Docker images will be downloaded to run an ElasticSearch and Kibana instance locally, to set up the Dashboard and run the ETL job to import the data. Here a sequence workflow to illustrate the chain of events is happening:
Conclusion
Getting insights into your data is so important and has never been so simple. GDA is an OpenSource and SaaS (Software as a Service) solution designed, implemented and operated by GerritForge. GDA allows setting up the extraction flows and gives you the “out-of-the-box” solution for accelerating your company’s business right now.
Contact usif you need any help with setting upa Data Analytics pipeline or if you have any feedback about Gerrit DevOps Analytics.
Time has come to migrate gerrithub.io to the latest Gerrit v2.16, from the outdated v2.15 we had so far. The big change between the two is the full adoption of NoteDB: the internal Gerrit groups were still kept in ReviewDb on v2.15, which forced us to keep a PostgreSQL instance active in production. This means we can finally say goodbye to the ReviewDb 👋 and eliminated yet another SPoF (Single-Point-of-Failure) from the GerritHub high-availability infrastructure.
Migrating to Gerrit v2.16 implies:
Gerrit WAR upgrade
GIT repos upgrade because of a change in the NoteDb format
Change in the database used, from PostgreSQL to H2 (for the schema_version)
Introduction of the new Projects index
The above is a quite complex process and, here at GerritForge, we executed the migration on a running GerritHub.io with 15k of active users avoiding any downtime during the migration.
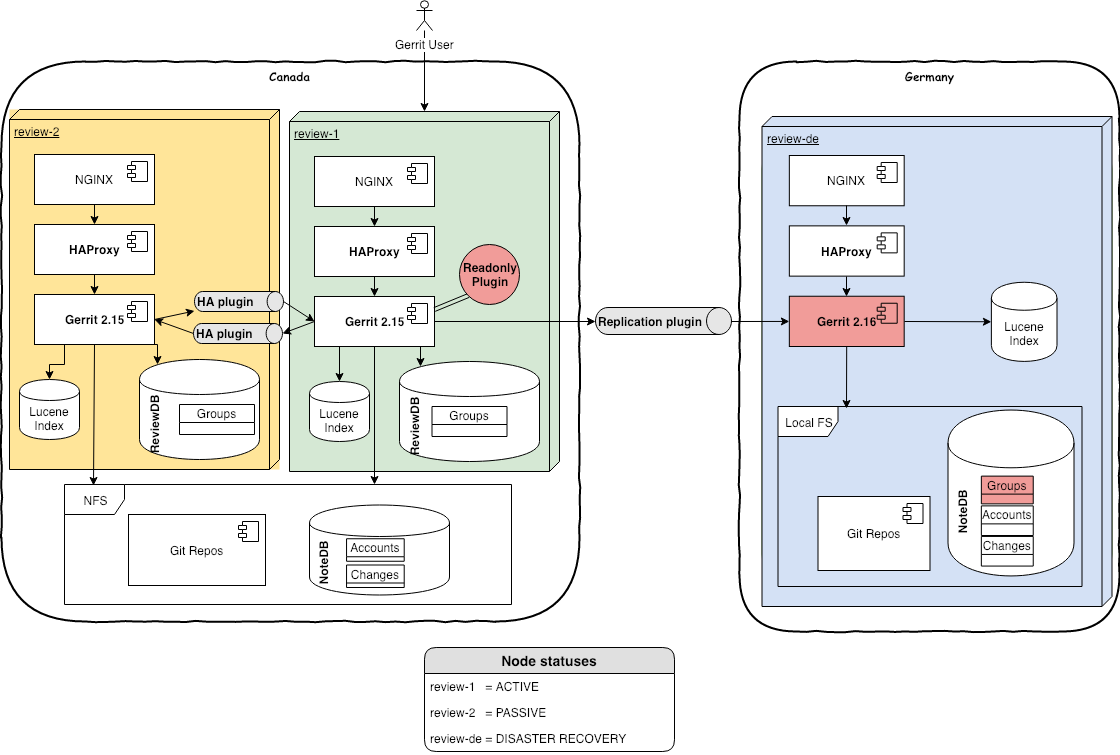
Architecture
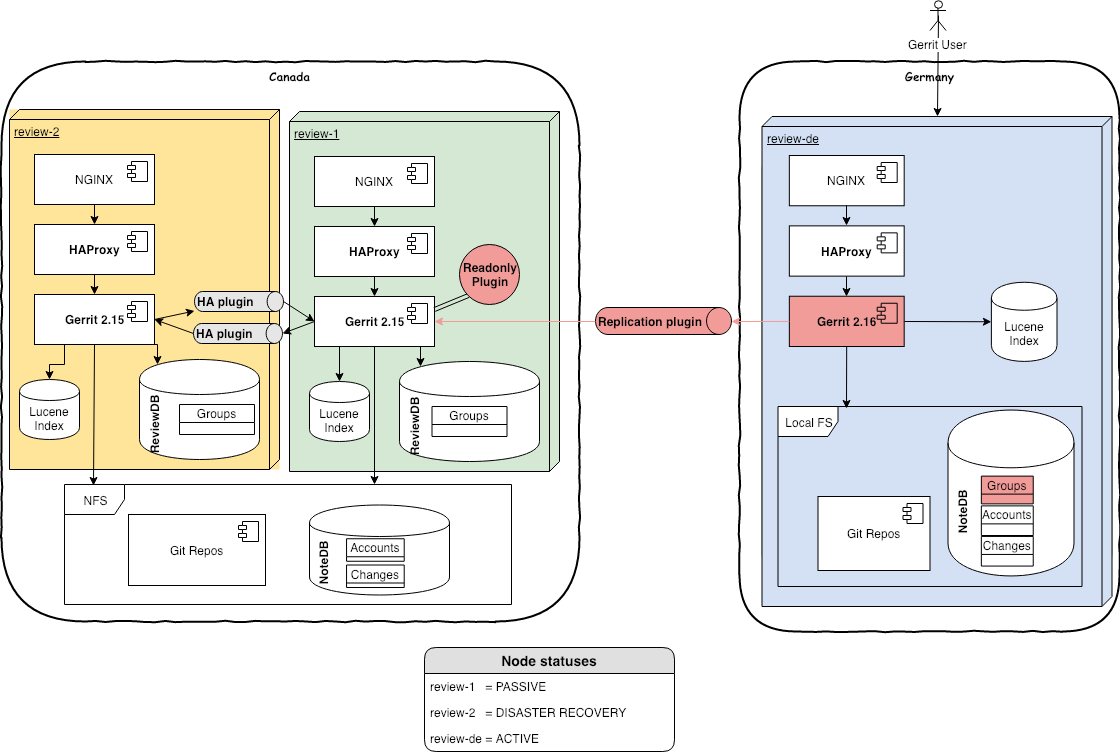
This is the initial architecture we are starting the GerritHub.io v2.15 migration from:
In this setup, we have 2 sites, one in Canada (active) and one in Germany (active for analytics and disaster recovery). The latter is aligned with the active master via replication plugin.
The HA Plugin used between the 2 Canadian nodes is a GerritForge fork enhanced with the ability to align the Lucene Indexes, Caches and Events when sharing repositories via NFS with caching enabled.
NOTE: The original High-Availability plugin is certified and tested on Gerrit v2.14 / ReviewDb only and requires the use of NFS without caching, which requires a direct fiber-channel connection between the Gerrit nodes the disks.
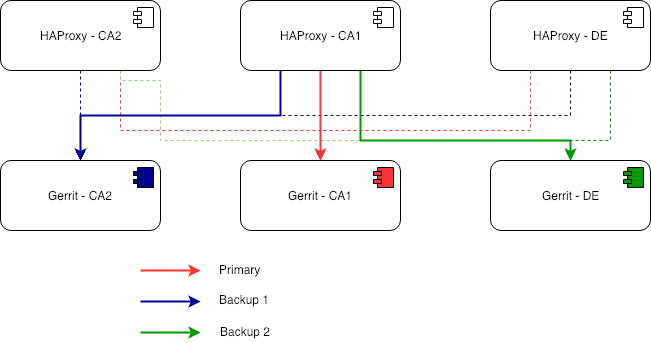
The traffic is routed with HAProxy to the active node. This allows us easy code migrations with no downtimes, using what we call the “ping-pong” technique between the Canadian and the German site, which is inspired by the classical Blue/Green deployment with some adjustments for the peculiarities of the Gerrit multi-site setup.
The migration pattern, in a nutshell, is composed of the following phases:
Upgrade code in Germany
The Gerrit site in Germany is used for Analytics and thus can be upgraded first with low risk associated.
German site -> passive, Canadian site -> active
Redirect traffic in Germany Once the site in Germany is ready and warmed up, the GerritHub users are redirected to it. GerritHub is technically serving the v2.16 user-experience to all users.
German site -> active, Canadian site -> passive
Upgrade code in Canada The site in Canada is put offline and upgraded as well.
German site -> active, Canadian site -> passive
Redirect traffic back to Canada Once the site in Canada is fully ready and warmed up, the entire user-base is redirected back.
German site -> passive, Canadian site -> active
Each HAProxy has the same configuration with a primary and 2 backups as follow:
Timeline of events – 2nd of Jan 2019
2/1/2019 – 8:00 GMT: Starting point of the GerritHub configuration
Review-1 – Gerrit 2.15 – active node
Review-2 – Gerrit 2.15 – failover node
Review-DE – Gerrit 2.15 – analytics node, used for disaster recovery
2/1/2019 – 10:10 GMT: Upgrade disaster recovery server
Stopped all services using Gerrit on review-de (we use the disaster recovery to crunch and serve the analytics dashboard)
Disabled replication plugin
Stopped Gerrit 2.15 and upgraded to Gerrit 2.16
Restarted Gerrit
2/1/2019 – 10:44 GMT: Re-enabled disaster recovery server
Re-Enabled replication from review 1…boom!
First issue: mirror option of the replication plugin was set to true, hence all the branches containing the groups on the All-Users repo been dropped from the recovery server. All the Groups were suddenly gone from the disaster recovery server
Remove mirror option in replication plugin
Re-Enabled replication from review-1…this time everything was ok!
Migration re-executed and everything was fine
2/1/2019 – 11:00 GMT: Removed ReviewDB
Once we were happy with the replication of the Groups we could remove PostgreSQL
The only information left outside NoteDB is the schema_version table, which contains only one row and it is static. We moved it into H2 by copying the DB from a vanilla 2.16 installation and changing Gerrit Config to use it.
Before the next step, we had to wait for the online reindexing on review-de to finish (~2 hours).
Note: we didn’t consider offline reindexing since it is basically sequential, and it would have been way slower compared to the concurrent online one. Additionally, it does not compute all the Prolog rules in full.
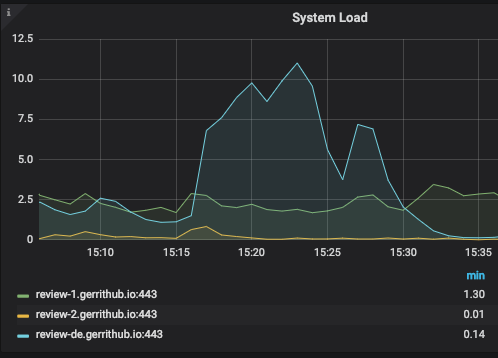
2/1/2019 – 15:15 GMT: Reduce delta between masters
Reducing the delta of data between the 2 sites (Canada and Germany) will allow having a shorter read-only window when upgrading the currently active master
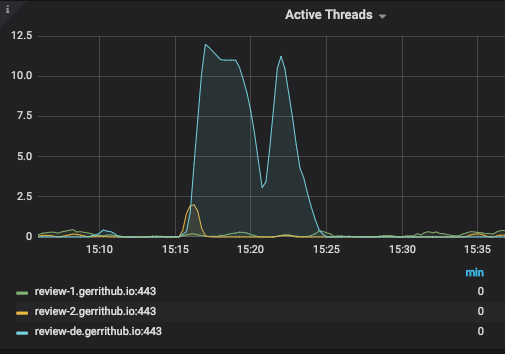
Manually replicate and reindex misaligned repositories on review-de (see below the effect on the system load)
Pro tip: if you want to check queue status to see, for example, if the replication is still ongoing this command can be used:
Service degraded for few minutes (i.e.: Gerrit was read-only), but most of the operations were available, i.e.: Gerrit index/query/plugin/version, git-upload-pack, replication
Waited for review-de to catch up with the latest changes that come in review-1 (we monitored it using the above “gerrit show-queue” command)
2/1/2019 – 15:54 GMT: Made disaster recovery active
Changed HAProxy configuration, and reloaded, to re-direct all the traffic to review-de, which become the active node in the cluster
See the transition of the traffic to review-de
Left review-de the whole night as the primary site. This way we also tested the disaster recovery site stability
2/1/2019 – 19:47 GMT: Upgrade review-1 and review-2 to Gerrit 2.16
Stopped Gerrit 2.15 and upgraded to Gerrit 2.16
Wait for offline reindexing of Projects, Accounts and Groups
Started with Gerrit 2.16 with online reindexing of the changes
It was possible to see an expected increase in the system load due to the reindexing, lasted for about 2 hours:
Furthermore, despite review-1 not being the active node, the HTTP workload grew disproportionately:
This was due to a well-known issue of the high-availability plugin, where the reindexing are forwarded to the passive nodes, creating an excessive workload on them.
3/1/2019 – 10:14 GMT: Made review 1 active
We used the same pattern used when upgrading review-de to align the data between masters
Changed HAProxy configuration, and reloaded, to re-direct back all the traffic to review-1
Conclusions
Migration was completed and production is back to stable again with the latest and greatest Gerrit v2.16.2 and the full PolyGerrit UI. With the migration of the Groups in NoteDB, ReviewDB leaves the stage completely to NoteDB. PostgreSQL is no more needed, simplifying the overall architecture.
The migration itself was quite smooth, the only issue was due to a plugin misconfiguration, nothing to have with Gerrit core. With the good monitoring we have in place, we managed to spot the issues straight away. Still, we will further automate our release process to avoid these issues from happening again.


 We have already discussed in