This week we are going to publish a talk from the Gerrit User Summit 2017 about Gerrit and Jenkins used together. It is a real-life story on how to set up a CI/CD pipeline for a massive traffic OpenSource project such as Gerrit Code Review and the learnings of how to manage the storage and consumption of the Jenkins build logs and the associated meta-data.
Even if you are not a Gerrit Code Review user, the learnings of this talk are going to be exciting and useful for any high load CI/CD pipeline project with Jenkins.
GerritForge: Gerrit Code Review and Jenkins expertise
I am part of GerritForge, a London-based limited company not specialized in Gerrit, as the name would tell, but also on Jenkins, Continuous Integration and Delivery. Why don’t we use our skills to serve the Gerrit Code Review project? A couple of years ago the project did not have an official CI yet, so we said: “why not help the project and set up an official pipeline to verify all the incoming Gerrit changes to the Gerrit Code Review project itself?”
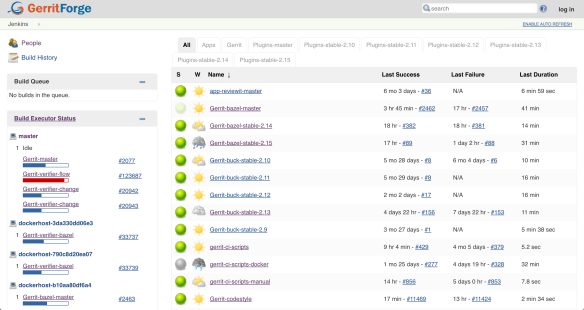
We then created https://gerrit-ci.gerritforge.com and, as you can see, it is nowadays a jam-packed CI system. We have been running a Hackathon over the weekend, and now, even while people in this room are following this talk, new changes are produced, and reviews are getting pushed to Gerrit, and that keeps our CI busy all the times.

We have a lot of slaves, some of them are provided for free by Google and others are paid by GerritForge. We have been running this service for the last couple of years, and even non-contributors to the Gerrit project like most of you guys are possibly using it for downloading some useful artifacts such as the Gerrit plugins. Additionally, if you want to download and demo the latest and greatest version of Gerrit master, as we just did with some of you before lunch, you can use the Gerrit artifacts on Gerrit-CI instead of building it yourself on your local box.
Gerrit-CI pipeline walkthrough
Let’s have a look at how Gerrit-CI works. You can log in with your GitHub credentials, and then trigger builds for your Gerrit Code Review contribution using a job called “Gerrit verifier change”. That is the most important job of the pipeline and it verifies every single change we make on the Gerrit Code Review project.
How can you manually trigger the build and verification of a change in Gerrit? You navigate to https://gerrit-ci.gerritforge.com/job/Gerrit-verifier-change/ and click on “Build with parameters” link. You enter your change number and then click “Build”: it is straightforward.
What this job does is triggering a workflow developed in Groovy language which it will provide at the end a series of feedback messages to Gerrit. When you go to https://gerrit-review.googlesource.com and list of open changes, you will notice that some of them by one guy that is called “GerritForge CI”. That means that our CI works, yeah!

At a certain point in time, someone in the Gerrit mailing list said: “Houston, we have a problem, we are too productive! We have produced so many changes and patch sets that the time you finish to build a change, we have already produced other 300 patch sets on that job and the build logs get lost”.
The Gerrit change verifier workflow
Let’s go back for a moment to review how the workflow that we came up with works. It does not rely on the Gerrit Trigger plugin, the de-facto out-of-the-box Gerrit/Jenkins integration that most of the people use, but rather on a complete “new thing” that we have built ad-hoc for our purpose.
We couldn’t use the Gerrit Trigger plugin because of two reasons:
- Google data-centers do not allow incoming SSH connections
- SSH stream event channel would not have been good enough for us, because of the parallelism needed.
The way that our workflow works if very simple.
The verifier flow requests the list of changes that need verification by leveraging Gerrit query language which allows you to search through most of the fields of changes using a Lucene syntax. For each change that needs checking, a corresponding number of parallel jobs are triggered. This parallelism is potentially unlimited; the only limit is the number of machines that Google can assign to the Gerrit-CI, if he can allocate one hundred, we will be able to perform hundreds of parallel changes verifications.

That means that we can produce a lot of verification jobs at the same time. Bear in mind that for every change we do not trigger just one build: we have NoteDb vs. ReviewDb verification, PolyGerrit UX tests, Code-Style check there was a moment in time where a single change needed up to 6 parallel builds! That resulted into a lot of builds, which, as long as you’ve got enough horsepower in the slaves, it was working fine us.
We do not send feedback to Gerrit for every single build, but we rather have a “Gerrit Verifier Change” job coordinating the workflow and makes a decision accordingly. The criteria are the number of failed builds, the build retries for flaky builds. At the end of the process, all build results are collected and a unique coordinated feedback to send back to Gerrit as a unique verification message.
Too many logs for Jenkins lead to a 404 page.
This is all good, but as we said earlier: “Houston, we have a problem, we are too productive!”.
Here are some numbers of our productivity:
- 300 jobs
- 170,000 builds
- 4.8 millions of jar artifacts produced
- 1.7 billions of lines of logs
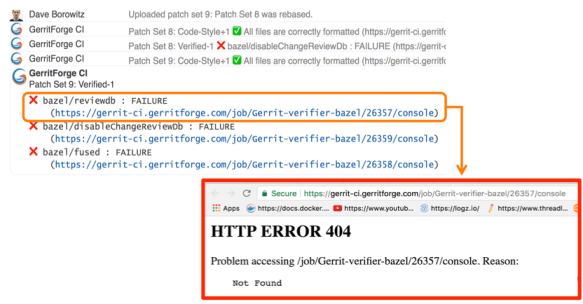
And of course, we want to send a link to the build logs we want to give context to the change failure or success. Unfortunately, happened to trace in Gerrit changes some nice links pointing to a quite unpleasant 404 page in Jenkins.
Why did it happen? We have a lot of contributors that generated lots of commit traffic and thus many build runs. There is a policy in Jenkins to remove “old” builds and thus happened that we lost build logs of active changes under review.

Q. (Han-Wen Nienhuys – Google) At Google internal build system we also this kind of numbers but of course with more zeros at the end, but actually we throw away our logs, and if you build binaries, they are very large.
In the beginning, we tried to keep more stuff online in Jenkins but people started saying “Luca, we have a much bigger problem now: gerrit-ci.gerritforge.com doesn’t respond anymore. When I open the Jenkins home page, it takes a very long time and eventually times out.”
That is caused by Jenkins design which is problematic when the number of logs increases considerably: everything is stored as a file and there is no efficient indexing for discovering the data on the filesystem. Additionally, if your company does not have a large infrastructure, your disk space is limited anyway. At GerritForge the Jenkins master has only 8TBytes of disk space, and we don’t have available a system with PetaBytes or more.
Keeping Jenkins logs forever
I made the Gerrit Contributors’ Community aware of the problem and I asked: do we like that? If you think about it, logs are not rubbish. Logs are of immense value, logs are like your money, and analyzing them, crunching and understanding them is our daily job. The timestamps in the logs are like precious diamonds because they tell you that you may have made a mistake in your code and some parts of your pipeline execution start taking a lot more time than before.
When you remove the “old” logs, you make much more difficult to investigate on a failed verification build: the link attached to the change verification message points to a page that returns a 404. That’s not a bug in Jenkins; it’s a feature of removing old logs and keeping the master instance fast and healthy. But actually, it is a real functionality gap because Jenkins doesn’t know yet how to manage logs archiving.
Then I asked the Community: “For how long you want your logs to be retained?” because I needed to raise a PO for a much bigger machine. “One day, one week, one month?” and the answer I got was “Forever!”
If you think about it carefully, the answer is correct. You may not need all those logs at the moment, but in a month’s time, you may need to crunch some data to extract features or metrics. Additionally, getting rid of all logs means generating broken links in my past reviews, which could be an audit requirement stored with Gerrit changes.
Sending Jenkins data to a Logstash appender
It was about time for me to think about a solution and here is a description of what I have done.
First of all, I needed to get more disk space from Google, but then how can I tell Jenkins to use an alternative disk storage mechanism for his logs?
I then started adding to the jobs a plugin called “Logstash” (https://wiki.jenkins.io/display/JENKINS/Logstash+Plugin) which is responsible for capturing and sending Jenkins data to a configured stream appender.
All the Gerrit CI jobs are managed through YAML files which are submitted through code-reviews, using the Jenkins Job Builder tool. However, showing the Logstash configuration on the Jenkins UI is much easier to show where the Logstash is playing a role in the Gerrit-verifier-change job configuration.

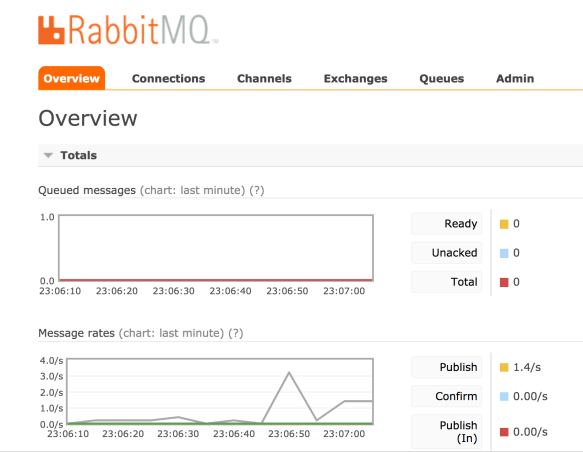
I have enabled a new feature to all the jobs to send all the log stream to the Logstash plugin. This works differently to what most of the people would do. Instead of just posting the log file into a stream of lines to ElasticSearch, this plugin gets the information directly from the JVM memory together with its metadata, the timestamp, the build parameters, the environment variables and send them to an endpoint, which could be anything. In this case, I have chosen to use RabbitMQ as stream appender. On RabbitMQ you can notice that I have created a queue for incoming Jenkins messages.

You may notice a lot of activity because every time that the Jenkins jobs produce something, a message is sent to RabbitMQ with the log and the attached meta-data. RabbitMQ is not used though as a storage system but acts only as a vehicle to transfer the information to a long-term storage system, which could be Google Cloud Storage.
The organization of files is straightforward: one file per hour. By looking at the file content, it is a very compressed JSON file that contains all the information I need: the build id, the result, the logs, the parameters.
Spark to the rescue
Problem solved? Can I tell all the Gerrit contributors that they have to look for a build result into a JSON file? Maybe this is not a very nice user experience.
I little more digging is needed to make the solution more transparent to the end user.

GerritForge as a company works and contributes to many BigData projects, including Apache Spark. Why don’t we build an elementary Spark transformation that consumes the input JSON files and materializes back the log into a readable format?
So we built a Spark job that is crunching this data and produces something very very similar to what Jenkins would render. However, we need to make sure to perform all those operations outside the Jenkins domain; otherwise, it would become very soon overloaded and thus unusable.
I have then created another directory that is not actually managed by Jenkins but gets populated by a Spark job. This parallel file structure has exactly the same organization of the build files generated by Jenkins builds.
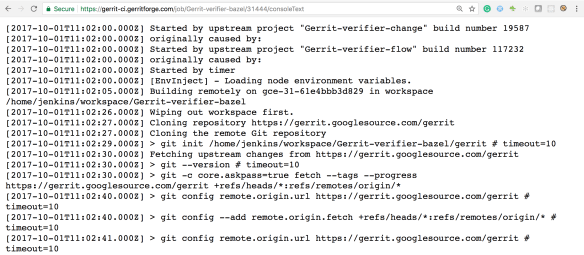
Let’s have a look for instance at the oldest build that has been recorded by Jenkins: build #31639. For sure if I go to the build #31444, which is older than the #31638, Jenkins would give me a 404 because that job execution has been removed.
However, if I try now to navigate to the build log #31444, wow, I can see the full results as the build log was still accessible.

Additionally, as this log has been produced from the previous JSON file that contains all the meta-data, I can even render more information such as the time-stamps, which are not typically available in Jenkins unless you enable a specific plugin.
Moving forward, by leveraging the same input JSON file, we could do a lot more data crunching as well. It would be interesting for instance to draw a graph of the correlation between the Gerrit changes the build execution times at the different stages.
Uncovering the hidden value of your Jenkins logs
There is a lot more we can do with the JSON I’ve shown you before. It contains not just the log messages, but everything related to the build meta-data of the build and its execution metrics. That means if we go to this change #129553, the link that points to Jenkins logs is not broken anymore, even if it is not served by Jenkins but is backed by the Spark job results.
Starting to applying the same mechanism to all the Gerrit changes and redirecting them to the Google storage where all the files are going to be archived, any change in the Gerrit history will not contain broken links anymore and will be perfectly auditable.
That means that from now, whenever you are going to receive a Verified notification from Gerrit and you navigate to your change links, you are not landing anymore to a 404 page anymore.
Questions.
Q: What if I have a Jenkins instance and I want to do some of this but I don’t have infinite disk-space as Google. Is it is possible to implement?
A: With regards to disk space, you don’t have to go to Google or AWS. You can set up an HDFS filesystem yourself. All the cloud storage implementations available on the Cloud are mainly based on something very similar to HDFS which is an open standard and is available as OpenSource. That means you can store the information there and you do not necessarily need to keep it forever. In practical terms what you need to keep is the lifetime of a release of the software, or a few software iterations, maybe six months, 12 months. As the JSON files are organized on a time-series, it is going to be very easy to remove or archive all the data you do not need anymore. I have shown you how to store those files in JSON, but you can use even more optimised and compressed format such as Avro or Parquet, which may contain 10x times the information in a fraction of disk space. Additionally, when you process them, they can be even faster because they include data encoded in binary format. In a nutshell, the term “keep the logs forever” could be read as “keep for as much as you need: one week, one month, six months, …”. The problem with Jenkins is that for very busy servers like the Gerrit CI, you cannot keep even a single day of logs and when the people are coming the next day to check what’s wrong with a failed verification, would risk having a 404 error page.
Q: So if you do compression and decompression, that needs to happen server-side, so that is transparent to the browser?
A: Yes, that needs to happen on the Server, and there are a lot of ways for doing it, it could be even done on-the-fly, streaming and is pretty fast. There will be a talk tomorrow talking about the methodology to crunch large amounts of data and about the lambda architecture.
Q: Does it generate a RabbitMQ message for each log statement or a unique one at the end of the build?
A: Yes, and the reason is straightforward: If the build crashes or gets aborted for any reason, you do not want to lose your build logs. There was an implementation of Logstash for the Jenkins pipeline that was precisely collecting the logs all at the end of the build, but the design is wrong because if the builds get aborted you do not get feedback at all. Yes, it generates a message for every single line, and possibly RabbitMQ is not the correct implementation of it. But as soon as the Logstash plugin supports the Kafka transport, the performance issues related to the use of RabbitMQ for log streaming will be resolved.
Q: The Logstash plugin that you mentioned, has nothing to do with the “ElasticLogstash” implementation?
A: Yes, it is just unfortunate naming. Actually, the Jenkins Logstash plugin was possibly born before Elastic called his implementation ‘logstash’.
Q: You mentioned that you do Spark processing at some point, but it wasn’t part of your presentation.
A: Yes, it is not part of this presentation for reasons of time, but it is trivial.
Q: Question about the GerritForge CI: I have frequent problems of the test failing not because of my code, and I want to retrigger the tests without having to add a commit to retrigger the CI. Is there a way to retrigger the CI build?
A: Yes, it can be done by going to the Gerrit-verifier-change URL, you click on “Build with Parameters” and enter your change number. You can in this way retrigger any build without having to commit anything.
Q: And if that pass that would assign the Verifier approval to the change?
A: Yes. I would like to add a Button to Gerrit-Review to avoid people to navigate to a different URL.
Q: We are relatively heavy users of Gerrit topics because we have changes that are across multiple repositories. We have a very similar job to this one but we can either put a single or multiple change IDs or a topic name, and it will work out whether it is a consistent declaration. Another thing that you can comment on, you mentioned that the verifier job which runs some independent verifications and then feeds the result as one result to Gerrit, that sounds like something we could use. What is that build using?
A: Tomorrow there will be a presentation of a brand-new integration between Gerrit and Jenkins. The rationale for writing a new integration lies on the thinking that “maybe the Gerrit project is not the only one that needs a bit more from Jenkins.” So why not creating a Jenkins plugin that takes the most of the experience we’ve made in integrating Gerrit with Jenkins for the Gerrit Code Review project and makes it available to the rest of the world? There will a plugin to implement that workflow.

