Gerrit Code Review RBE: moving to BuildBuddy on-prem

The Gerrit Code Review Open-Source project has transitioned from using Google Cloud Platform’s Remote Build Execution (RBE) to BuildBuddy’s on-premises to address performance, stability, and latency issues. The migration process included setting up a new Jenkins controller and provisioning BuildBuddy executors on newly provisioned on-premises boxes, which showed significantly reduced build times and a more consistent and reliable performance. After thorough evaluation and community consensus, BuildBuddy was adopted as the new default for Gerrit’s CI/CD pipeline, enhancing overall efficiency and stability.

Historical Context

The Gerrit Code Review project has undergone significant evolution in its build processes to enhance efficiency and performance. This evolution reflects the increasing complexity and demands of modern CI/CD pipelines.

Overview of Gerrit Code Review

Gerrit is a powerful code review tool with a powerful web and command-line interface, all built on top of the Git open-source project. Gerrit codebase is significant and multifaceted, using Python tooling, TypeScript front-end and a Java-based backend. To appreciate the challenges and the need for robust build tools, consider the scope of Gerrit’s codebase and build activity:

  • Plugins: Gerrit comprises 14 core plugins maintained as git submodules, plus a universe of over 300 community-based plugins developed in multiple languages, from Java to Scala and Groovy.
  • Java Codebase: The project includes 6011 Java files, with 4765 dedicated to production code, amassing ca. 411,768 lines of code (LoC). Additionally, there are 1246 test files (924 unit tests and 322 integration tests) contributing another ca. 276,632 LoC.
  • Frontend Codebase: The frontend is built with 110 JavaScript files (ca. 2345 LoC), 733 TypeScript files (ca. 175,765 LoC), 293 HTML files, and 9 CSS files.
  • Dependencies: Gerrit relies on 135 Java dependencies managed through Maven and 25 NPM dependencies (5 runtime and 20 development).

Gerrit has been founded in 2008 and has over 15 years of code-history, which reflects the evolution of the build tools, Java VMs and front-end technologies used for over a decade. The pre-requisites that you would have to manage in order to build Gerrit are diverse and quite challenging.

Build and Verification Activity

The Gerrit project is highly active, with rigorous commit-level verification processes to ensure code quality and stability. For example, from June 9 to June 23, 2024, Gerrit handled:

Total of changes:

BranchNumber of changes
master65
stable-3.1018
stable-3.916
stable-3.815
stable-3.72
stable-3.60
stable-3.51
stable-3.41
Total118

Total of revisions (patch sets):

BranchNumber of revisions
master230
stable-3.1086
stable-3.921
stable-3.822
stable-3.74
stable-3.60
stable-3.54
stable-3.41
Total368

Total of Gerrit verifications:

Type of verificationnumber of verifications
Build/Tests277
Code Style320
PolyGerrit UI Tests124
RBE BB Build/Tests271
Total992

Evolution of Build Tools

The journey of Gerrit’s build tools reflects its growth and the increasing complexity of its CI/CD requirements:

  1. Apache Maven: Up until version 2.7, Gerrit used Apache Maven as its build tool. Maven, known for its comprehensive project management capabilities, was sufficient during Gerrit’s early stages.
  2. Buck: From version 2.8 to 2.13, Gerrit transitioned to Buck, a build tool designed for faster builds. Buck’s incremental build capabilities helped manage the growing codebase more efficiently than Maven.
  3. Bazel: Since version 2.14, Bazel has been the default build tool for Gerrit. Bazel’s advanced features, including its support for remote caching and execution, provided significant improvements in build performance and scalability.

Transition to Bazel with Remote Execution and Caching

In December 2020, Gerrit Code Review made a significant shift by adopting Bazel with remote execution and caching to address the challenges of long build times. This strategic move aimed to leverage Bazel’s advanced capabilities to enhance the efficiency of the CI processes.

Reasons for the Shift

The primary driver for this transition was the increasing build times due to the growing complexity and size of the Gerrit codebase. The conventional local build processes were becoming a bottleneck, slowing down the development and integration cycles.

Implementation with GCP Remote Build Execution (RBE)

Gerrit integrated Google Cloud Platform’s Remote Build Execution (GCP RBE) as the remote server to support this transition. The integration provided several key benefits:

  • Reduced Build Times: By offloading build and test tasks to powerful remote servers, build times were significantly reduced.
  • Efficient Resource Utilization: Local machines were freed from heavy build tasks, allowing developers to continue working without interruptions.
  • Scalability and Parallelisation: Remote execution and the parallelisation of Gerrit’s Bazel tasks allowed to leverage the scalable cloud resources.

This implementation marked a crucial enhancement in Gerrit’s CI/CD pipeline, setting the stage for further optimisations and improvements in the build process.

Motivation to find RBE alternatives

The RBE implementation on Google Cloud has served the Gerrit Code Review project successfully for many years; however, the needs of the project grew over time and the CI/CD infrastructure had to satisfy additional requirements.

  1. Stability: Google Cloud is SaaS solution which could be flaky at times, whilst the project needed a stable deployment with full control on its stability not influenced by external factors.
  2. Latency between the controller and the executors: the latency between the main CI/CD controller (Jenkins) and the RBE executors paid a significant price for shorter builds like the Code-Style checks, whilst a localised data processing resulted in faster build times and quicker feedback cycles.
  3. Predictability: Consistent and reliable performance is crucial for efficient CI/CD workflows.

Moving to BuildBuddy RBE

BuildBuddy is an open-core Bazel build event viewer, result store, remote cache, and remote build execution platform that provided many new benefits to the Gerrit Code Review builds:

  1. Integration and Customisation: the integration with the existing CI/CD pipelines was straightforward.
  2. Open Source Community: BuildBuddy, being open-core, benefits from community-driven innovation and collaborative support.
  3. Enterprise Features: BuildBuddy Enterprise offers advanced features for companies that need robust capabilities:
    • OpenID Connect Auth Support: Integrates with Google OAuth.
    • Remote Build Execution: Supports custom Docker images.
    • Configurable Bazel Caches TTL: Allows setting TTL for build results and cache with support for persistent build artifact storage.
    • High Availability: Configurations for high availability also on-premises
  4. Control and Stability: On-premise deployment offers full control and enhanced stability by minimizing reliance on external factors.
  5. Very Low Latency: Localized data processing results in faster build times and quicker feedback cycles: we could locate the executors and the Jenkins controller in the same data-centre with micro-seconds network latency.
  6. Predictable Performance: Consistent and reliable performance is crucial for efficient CI/CD workflows, thanks to the dedicated always-on executors.

BuildBuddy RBE allowed more development efficiency and reliability for the Gerrit Code Review project, making it a compelling choice for optimizing CI/CD processes while leveraging the benefits of open-source software and robust enterprise features.

What was the migration plan ?

To clarify a few points for a better understanding of the this section:

  1. Scope of Bazel RBE Execution: Bazel RBE is executed only in the Gerrit project and its core plugins (git submodules). It is not executed in non-core plugins, such as pull-replication, high-availability, multi-site, etc.
  2. Branch Support: From a CI/CD perspective, only the master branch and the last three stable branches are supported for Gerrit project, core and non-core plugins. At the time of the migration, these branches were master, stable-3.7, stable-3.8, and stable-3.9.

The initial phase of the migration aimed to assess the reliability and stability of BuildBuddy RBE. A priority in this phase was to maintain the current CI/CD process while simultaneously evaluating BuildBuddy RBE without any disruptions.

To achieve this phase, several updates and new services were implemented:

Adding BuildBuddy Bazel remote configuration in Gerrit master branch.

Provisioning BuildBuddy Executors: A cloud host was provisioned with the following specifications: 128 CPUs, Intel(R) Xeon(R) Gold 6438Y+, 128GB RAM, and SSD. This host runs 3 BuildBuddy executors (as docker containers).

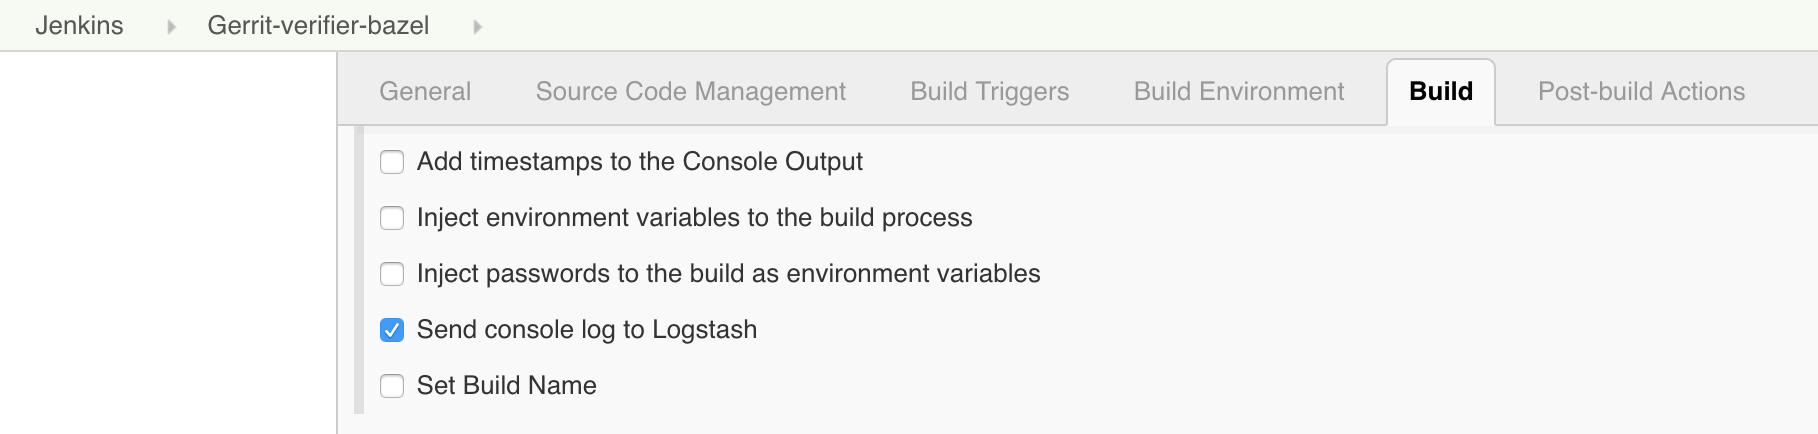
Setting up a new Gerrit CI Server: A new Jenkins server was set up to run build jobs against BuildBuddy RBE on the Gerrit master branch. This server is not accessible from outside.

Registering a new Gerrit verification: A new verification named RBE BB Build/Tests was added to gerrit-review.googlesource.com to trigger builds on the new Gerrit CI server whenever a new revision was created on the Gerrit master branch.

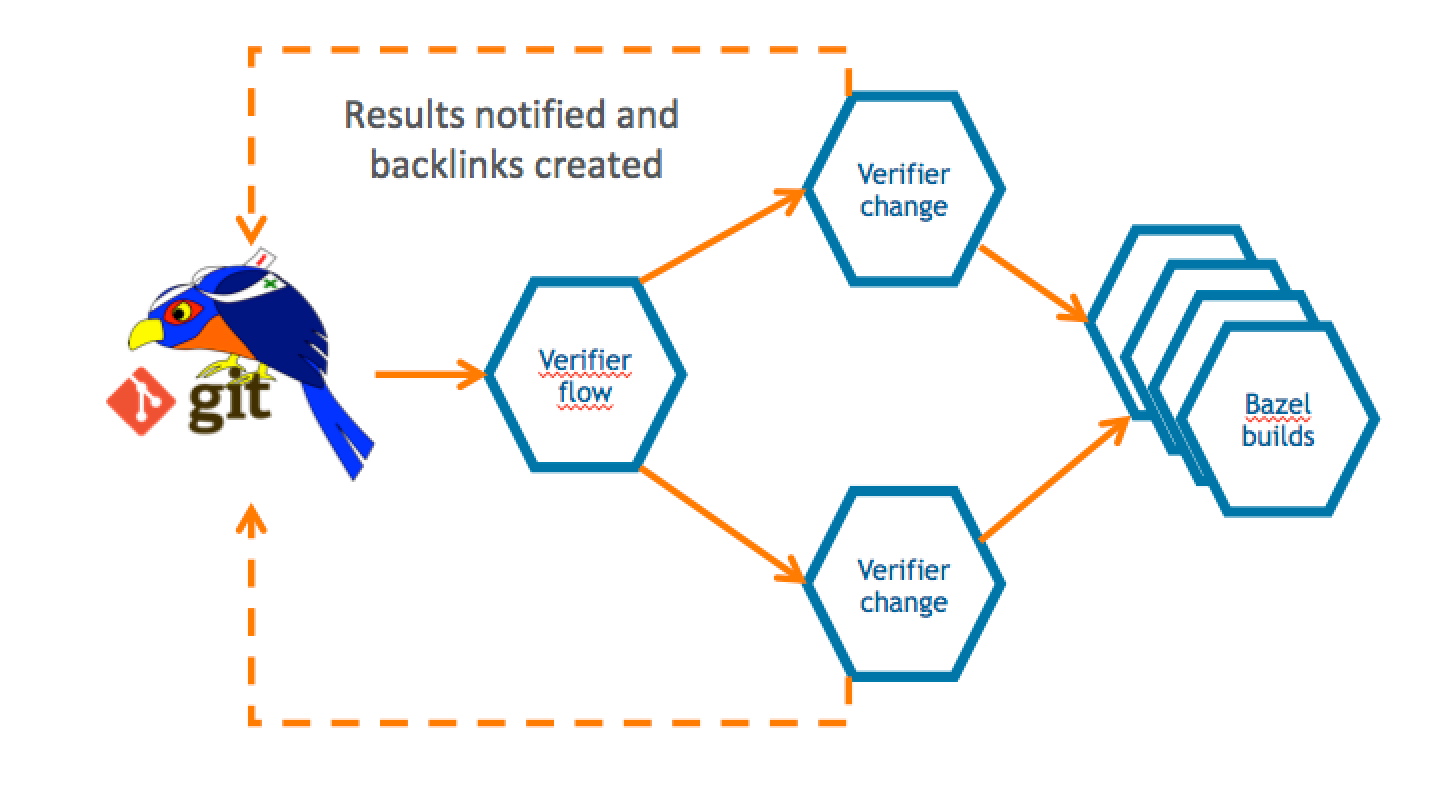
Figure 1: Architecture Migration diagram with default CI flow and new BuildBuddy CI flow:

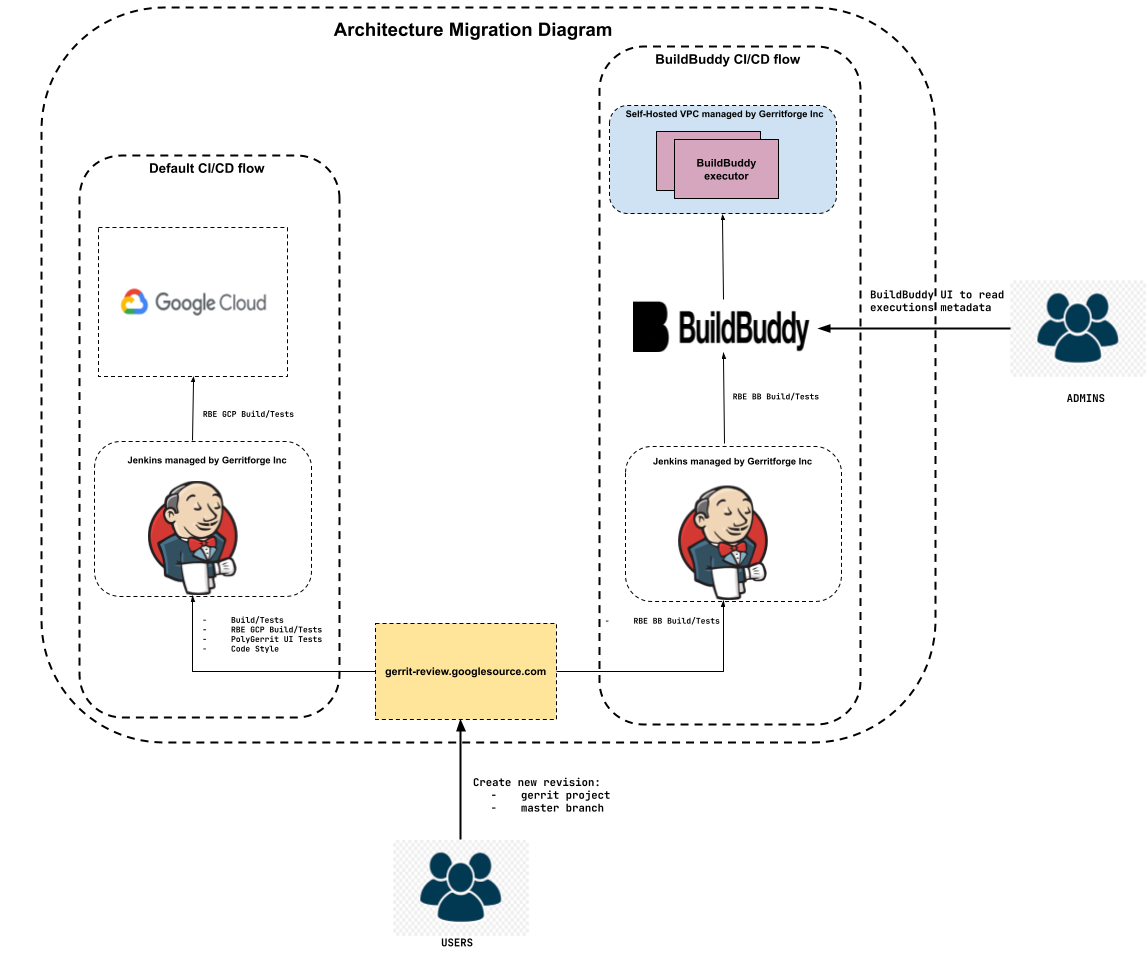
How is the new CI/CD flow?

In the default CI flow, when a user creates a new revision (patch set) in Gerrit master, or stable-3.7 or stable-3.8 or stable-3.9 branches, a set of verification jobs trigger Jenkins jobs. These verification jobs include:

  • RBE GCP Build/Tests: Builds the codebase and executes all the unit/integration tests on GCP RBE.
  • Code Style: Checks Java and Bazel formatting, and JavaScript lint.
  • Build/Tests: Builds the codebase and executes one single no-op test.
  • PolyGerrit UI Tests: Executes unit/integration tests for PolyGerrit UI.

If any of the verification jobs fail, the verification status of the revision is marked with a -1.

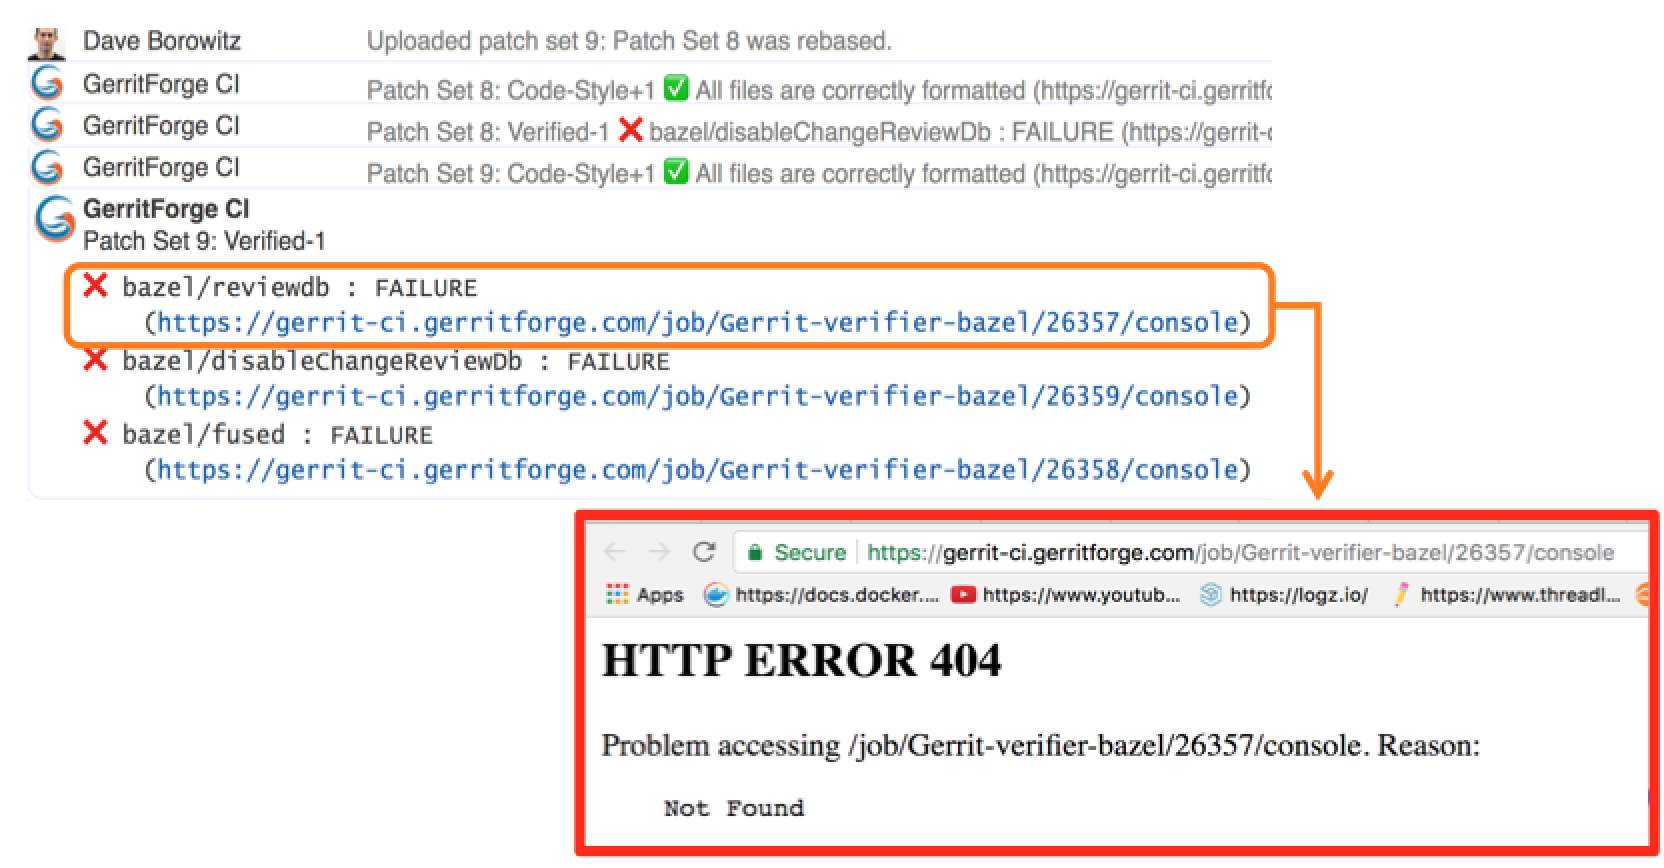
As mentioned earlier, the intention when testing the reliability and stability of BuildBuddy RBE was to avoid interfering with the default CI/CD flow. To achieve this, a new verification job called RBE BB Build/Tests was added. This verification triggers a Jenkins job on the new Gerrit CI, which builds the codebase and executes unit/integration tests on BuildBuddy RBE. This setup allowed the default flow and the BuildBuddy RBE flow to coexist without affecting each other.

It is important to note two things:

  • Only revisions in the master branch of Gerrit project triggered this new verification job. The data collected from the master branch is sufficient to draw conclusions.
  • The status of this new verification job does not affect the overall verification status of the revision.

Figure 2: Verification jobs, default ones and the BuildBuddy RBE, triggered in a Gerrit master branch revision:

Once the first phase concluded, it was important to analyze the data to determine if BuildBuddy RBE was reliable and stable enough to proceed to the next phase. In the second phase, the plan was to evaluate the performance of BuildBuddy RBE against GCP RBE. Architecturally, the CI/CD process remained the same as in the first phase, with one key difference: the verification job RBE BB Build/Tests would be triggered when revisions were created for the Gerrit repo on the master, stable-3.7, stable-3.8, and stable-3.9 branches. This was necessary to ensure that BuildBuddy RBE handled the same number of jobs as GCP RBE, allowing for a fair performance comparison.

Data Collection

Before analysing the data, it’s imperative to elucidate our data collection methodology. To procure the build data (build number, execution time in GCP RBE and BB RBE and status), we developed a script in python that employed two APIs:

Notes:

  • Build number is a unique number represented by the tuple: (change number, revision number).
  • All the graphs show builds in chronological order.
  • The build numbers are not shown in the graphs for readable purposes.
  • Builds labelled as “RUNNING” or those lacking specification according to the API have been excluded from the calculations.

Key Performance Indicators

  • Average Build Time: Calculate the average build time for each platform (GCP RBE and BuildBuddy RBE) to understand the typical time it takes to complete a build on each platform.
  • Percentage of Builds Faster: Determine the percentage of builds that are completed faster on BuildBuddy RBE compared to GCP RBE. This helps assess which platform is more efficient in terms of build time.
  • Overall Success Rate / Failure Rate: Calculate the overall success and failing rate of builds on BuildBuddy RBE. This considers both successful and failed builds to provide a comprehensive view of platform reliability.
  • Outliers (>60 minutes): Identify the percentage of builds that exceed a certain threshold, such as 60 minutes in BuildBuddy RBE. This helps pinpoint builds that take exceptionally long and may require investigation or optimization.
  • Average Build Time Reduction: Determine the average reduction in build time when using BuildBuddy RBE compared to GCP RBE. This quantifies the efficiency improvement gained by using the BuildBuddy platform.

PHASES

As we mentioned above, the migration has been segmented into two distinct phases:

Phase 1: Spanning from December 28th, 2023, to February 9th, 2024, during which RBE BuildBuddy operated against the Gerrit master branch.
Phase 2: Commencing from February 10th, 2024, to February 26th, during which RBE BuildBuddy operated against the Gerrit master, stable-3.7, stable-3.8, and stable-3.9 branches.

Phase 1: Evaluate if BuildBuddy RBE offers stability and low latency

To make the data more readable and understandable, I have split the data into 2 graphs:

Figure 3: RBE Successful Build time for Gerrit master between 28th December 2023 to 18th January 2024:

Figure 4: RBE Successful Build time for Gerrit master between 19th January 2024 to 9th February 2024:

Total number of builds:

master
GCP Builds489
BB Builds489

Build status:

BB SuccessfulBB failed
GCP Successful39017
GCP Failed082

Initially, 3.47% of BuildBuddy RBE builds failed due to CPU exhaustion caused by running 100 BuildBuddy executors simultaneously. This problem was addressed by reducing the number of executors to 3. BuildBuddy engineers advise running only one executor container per host/node, with each executor capable of handling multiple RBE Actions concurrently. For each action, an executor initiates an isolated runner to execute it. We plan to reassess our configuration in due course.

Average build time when GCP and BuildBuddy builds were successful:

Minutes
GCP Average18.69
BB Average10.2

Where the average build time reduction is 8.49 minutes and 96.4% (376 out of 390 builds) of BuildBuddy builds are faster than GCP builds.

We discovered that 1.5% of BuildBuddy successful builds were outliers. This was due to the need for a restart of the new Gerrit CI server, which caused temporary disruptions.

change_numberREVISION_NUMBERGCP RBE MINUTESBB RBE MINUTES
40039816.7868.68
3996571113.71293.55
3996571421.45137.47
400958214.52154.3
247812726.6267.17
406597114.1879.55

Average time when GCP and BB Failed:

Minutes
GCP Average17.68
BB Average23.29

Conclusions:

Assessing performance and stability, the results were promising, with the BuildBuddy platform showcasing superior performance, as highlighted in the table “Average build time when GCP and BB Successful”. Additionally, issues with BuildBuddy failing builds during successful GCP builds were addressed, primarily stemming from resolved configuration problems. Although outliers represented a mere 1.5%, their significance was negligible. However, despite these favourable outcomes, caution was warranted due to the higher volume of builds in GCP compared to BuildBuddy, attributed to GCP’s operation across stable branches.

Phase 2: Compare BuildBuddy RBE with GCP RBE based on performance

To make the data more readable and understandable, The data has been splitted into 4 graphs:

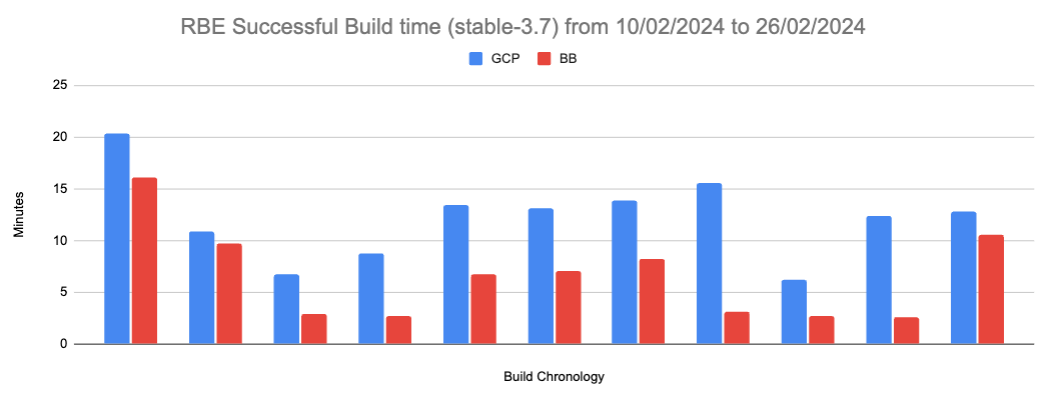
Figure 5: RBE Successful Build time for Gerrit master:

Figure 6: RBE Successful Build time for Gerrit stable-3.9:

Figure 7: RBE Successful Build time for Gerrit stable-3.8:

Figure 8: RBE Successful Build time for Gerrit stable-3.7:

Successful BB Build status / Successful GCP Build status:

masterstable-3.9stable-3.8stable-3.7Total
Builds11926611162

Average time when GCP and BB Successful:

Minutes
GCP Average13.91
BB Average8.45

Where the average build time reduction is 5.46 minutes and 90.74% (147 out of 162 builds) of BuildBuddy builds are faster than GCP builds.

Failed BB Build states / Failed GCP Build status:

masterstable-3.9stable-3.8stable-3.7Total
Builds30121144

Failed BB Build status / Successful GCP Build status:

masterstable-3.9stable-3.8stable-3.7Total
Builds12003

It is worth noting that 1.14% of BuildBuddy builds failed.

Average time when GCP and BB builds failed

Minutes
GCP Average10.96
BB Average9.43

Conclusions:

The findings indicated that the BuildBuddy scenario demonstrated a more consistent performance, due to the on-premises allocated resources, as emphasised in the table “Average build time when GCP and BB Successful,” with comparable volumes of builds. Moreover, the stability remained highly consistent, evident from the table “Failed BB Build status / Successful GCP Build status,” alongside the absence of outliers.

Gerrit code review community decision

On February 27, 2024, the collected data was shared with the Gerrit code review open-source community. After careful consideration and thorough analysis, BuildBuddy was found to demonstrate remarkable stability. While it cannot be definitively stated that BuildBuddy surpasses GCP in all aspects, it notably outperforms GCP in terms of latency. Given its superior latency performance and strong stability, the decision was made to adopt BuildBuddy to replace GCP in the CI/CD pipeline.

Final migration phase

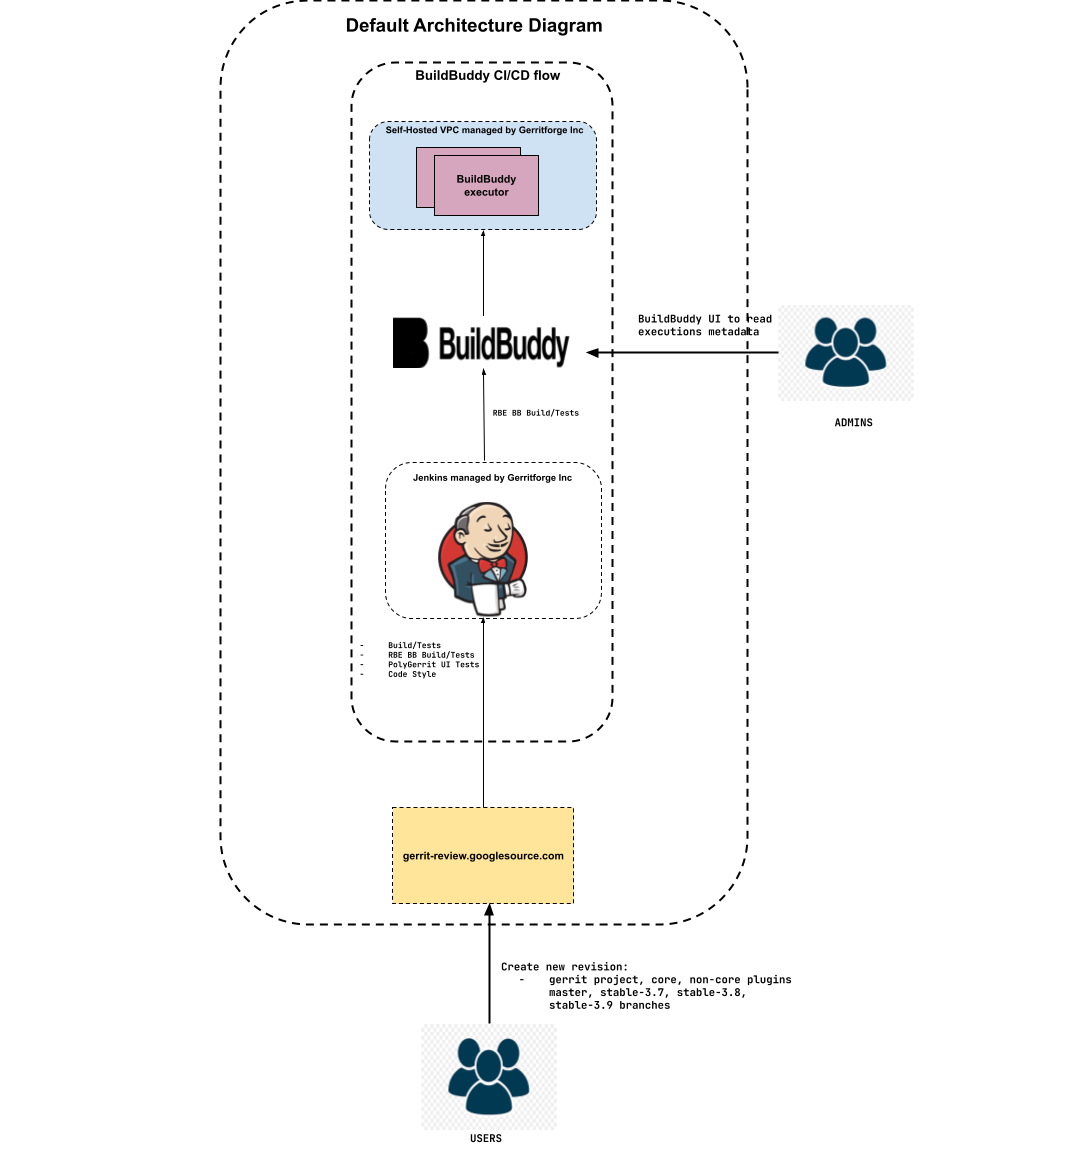
On March 29, 2024, the new Gerrit CI was established as the default CI using BuildBuddy RBE, and the following actions were taken:

  • Decommissioned the old Gerrit CI server.
  • Configured Gerrit CI to support both core and non-core plugin jobs, ensuring external visibility.
  • Unregistered the Gerrit verification RBE GCP Build/Tests on gerrit-review.googlesource.com.

Figure 9: Default Architecture diagram with BuildBuddy CI/CD flow as default CI/CD flow:

Final Conclusions

Following the completion of the migration, data on BuildBuddy RBE was collected from May 1, 2024, to June 24, 2024, to validate all assumptions. Subsequent statistical analysis yielded the following results:

Figure 10: Successful Builds:
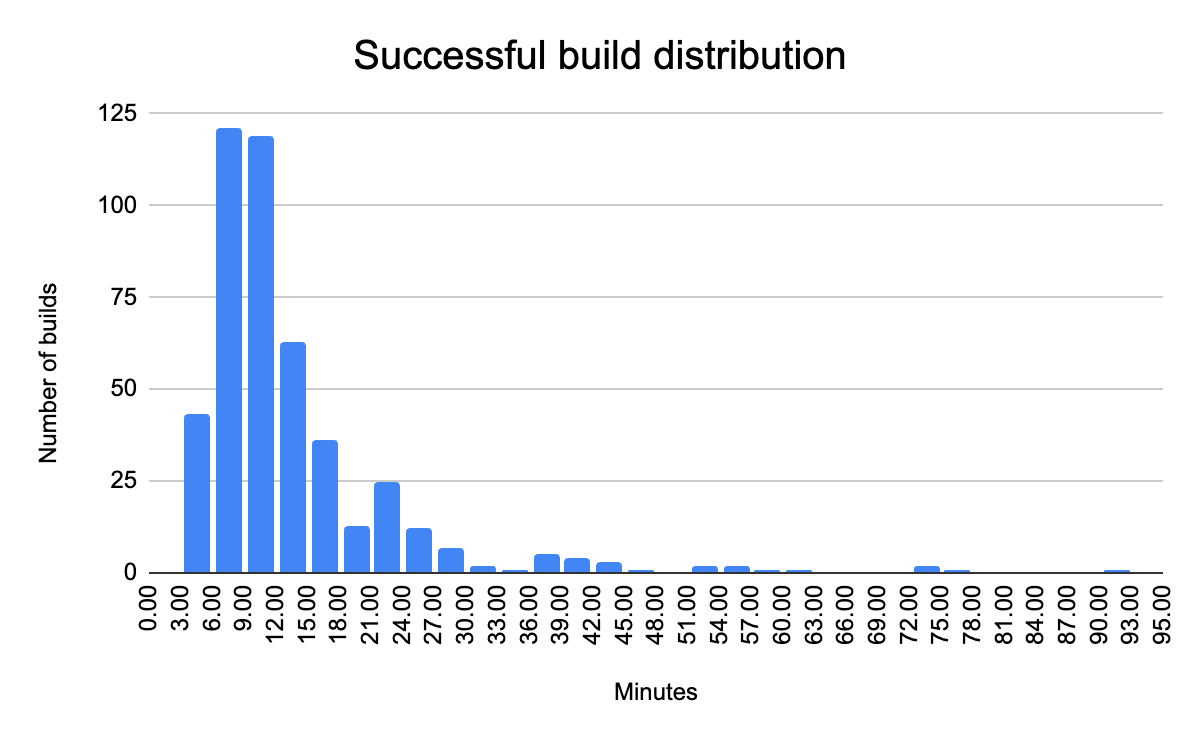
Builds465
Mean13.62 min
Median10.47 min
Standard dev10.79 minA higher standard deviation indicates that the build times are spread out over a wide range, meaning there is a lot of variability in the times
Q315.23 min75% of builds are completed in less than 15.23 minutes.

Figure 11: Failed Builds:

Builds105
Mean7.72 min
Median6.22 min
Standard dev7.56 min
Q37.7 min75% of builds are completed in less than 7.7 minutes.

While we are satisfied with our current results, we recognize the need for improvements in our successful builds. Our next step will be to analyze all the build data provided by the BuildBuddy dashboard, including target-level metrics, timing, artifacts, cache, and executions. This analysis will help us enhance the Bazel configuration and improve build performance.

Figure 12: BuildBuddy dashboard


Alvaro Vilaplana-Garcia – Gerrit Code Review Contributor
Luca Milanesio – Gerrit Code Review Maintainer and Release Manager

Gerrit User Summit: Jenkins forever

This week we are going to publish a talk from the Gerrit User Summit 2017 about Gerrit and Jenkins used together. It is a real-life story on how to set up a CI/CD pipeline for a massive traffic OpenSource project such as Gerrit Code Review and the learnings of how to manage the storage and consumption of the Jenkins build logs and the associated meta-data.

Even if you are not a Gerrit Code Review user, the learnings of this talk are going to be exciting and useful for any high load CI/CD pipeline project with Jenkins.

GerritForge: Gerrit Code Review and Jenkins expertise

I am part of GerritForge, a London-based limited company not specialized in Gerrit, as the name would tell, but also on Jenkins, Continuous Integration and Delivery. Why don’t we use our skills to serve the Gerrit Code Review project? A couple of years ago the project did not have an official CI yet, so we said: “why not help the project and set up an official pipeline to verify all the incoming Gerrit changes to the Gerrit Code Review project itself?”

We then created https://gerrit-ci.gerritforge.com and, as you can see, it is nowadays a jam-packed CI system. We have been running a Hackathon over the weekend, and now, even while people in this room are following this talk, new changes are produced, and reviews are getting pushed to Gerrit, and that keeps our CI busy all the times.

Screen Shot 2017-10-24 at 22.51.04.png

We have a lot of slaves, some of them are provided for free by Google and others are paid by GerritForge. We have been running this service for the last couple of years, and even non-contributors to the Gerrit project like most of you guys are possibly using it for downloading some useful artifacts such as the Gerrit plugins. Additionally, if you want to download and demo the latest and greatest version of Gerrit master, as we just did with some of you before lunch, you can use the Gerrit artifacts on Gerrit-CI instead of building it yourself on your local box.

Gerrit-CI pipeline walkthrough

Let’s have a look at how Gerrit-CI works. You can log in with your GitHub credentials, and then trigger builds for your Gerrit Code Review contribution using a job called “Gerrit verifier change”. That is the most important job of the pipeline and it verifies every single change we make on the Gerrit Code Review project.

How can you manually trigger the build and verification of a change in Gerrit? You navigate to https://gerrit-ci.gerritforge.com/job/Gerrit-verifier-change/ and click on “Build with parameters” link. You enter your change number and then click “Build”: it is straightforward.

What this job does is triggering a workflow developed in Groovy language which it will provide at the end a series of feedback messages to Gerrit. When you go to https://gerrit-review.googlesource.com and list of open changes, you will notice that some of them by one guy that is called “GerritForge CI”. That means that our CI works, yeah!

houston1.jpg

At a certain point in time, someone in the Gerrit mailing list said: “Houston, we have a problem, we are too productive! We have produced so many changes and patch sets that the time you finish to build a change, we have already produced other 300 patch sets on that job and the build logs get lost”.

The Gerrit change verifier workflow

Let’s go back for a moment to review how the workflow that we came up with works. It does not rely on the Gerrit Trigger plugin, the de-facto out-of-the-box Gerrit/Jenkins integration that most of the people use, but rather on a complete “new thing” that we have built ad-hoc for our purpose.
We couldn’t use the Gerrit Trigger plugin because of two reasons:

  1. Google data-centers do not allow incoming SSH connections
  2. SSH stream event channel would not have been good enough for us, because of the parallelism needed.

The way that our workflow works if very simple.
The verifier flow requests the list of changes that need verification by leveraging Gerrit query language which allows you to search through most of the fields of changes using a Lucene syntax. For each change that needs checking, a corresponding number of parallel jobs are triggered. This parallelism is potentially unlimited; the only limit is the number of machines that Google can assign to the Gerrit-CI, if he can allocate one hundred, we will be able to perform hundreds of parallel changes verifications.

Screen Shot 2017-10-24 at 22.53.30.png

That means that we can produce a lot of verification jobs at the same time. Bear in mind that for every change we do not trigger just one build: we have NoteDb vs. ReviewDb verification, PolyGerrit UX tests, Code-Style check there was a moment in time where a single change needed up to 6 parallel builds! That resulted into a lot of builds, which, as long as you’ve got enough horsepower in the slaves, it was working fine us.

We do not send feedback to Gerrit for every single build, but we rather have a “Gerrit Verifier Change” job coordinating the workflow and makes a decision accordingly. The criteria are the number of failed builds, the build retries for flaky builds. At the end of the process, all build results are collected and a unique coordinated feedback to send back to Gerrit as a unique verification message.

Too many logs for Jenkins lead to a 404 page.

This is all good, but as we said earlier: “Houston, we have a problem, we are too productive!”.
Here are some numbers of our productivity:

  • 300 jobs
  • 170,000 builds
  • 4.8 millions of jar artifacts produced
  • 1.7 billions of lines of logs

And of course, we want to send a link to the build logs we want to give context to the change failure or success. Unfortunately, happened to trace in Gerrit changes some nice links pointing to a quite unpleasant 404 page in Jenkins.

Why did it happen? We have a lot of contributors that generated lots of commit traffic and thus many build runs. There is a policy in Jenkins to remove “old” builds and thus happened that we lost build logs of active changes under review.

Screen Shot 2017-10-24 at 22.59.39.png

Q. (Han-Wen Nienhuys – Google) At Google internal build system we also this kind of numbers but of course with more zeros at the end, but actually we throw away our logs, and if you build binaries, they are very large.

In the beginning, we tried to keep more stuff online in Jenkins but people started saying “Luca, we have a much bigger problem now: gerrit-ci.gerritforge.com doesn’t respond anymore. When I open the Jenkins home page, it takes a very long time and eventually times out.”

That is caused by Jenkins design which is problematic when the number of logs increases considerably: everything is stored as a file and there is no efficient indexing for discovering the data on the filesystem. Additionally, if your company does not have a large infrastructure, your disk space is limited anyway. At GerritForge the Jenkins master has only 8TBytes of disk space, and we don’t have available a system with PetaBytes or more.

Keeping Jenkins logs forever

I made the Gerrit Contributors’ Community aware of the problem and I asked: do we like that? If you think about it, logs are not rubbish. Logs are of immense value, logs are like your money, and analyzing them, crunching and understanding them is our daily job. The timestamps in the logs are like precious diamonds because they tell you that you may have made a mistake in your code and some parts of your pipeline execution start taking a lot more time than before.

When you remove the “old” logs, you make much more difficult to investigate on a failed verification build: the link attached to the change verification message points to a page that returns a 404. That’s not a bug in Jenkins; it’s a feature of removing old logs and keeping the master instance fast and healthy. But actually, it is a real functionality gap because Jenkins doesn’t know yet how to manage logs archiving.

Then I asked the Community: “For how long you want your logs to be retained?” because I needed to raise a PO for a much bigger machine. “One day, one week, one month?” and the answer I got was “Forever!”

If you think about it carefully, the answer is correct. You may not need all those logs at the moment, but in a month’s time, you may need to crunch some data to extract features or metrics. Additionally, getting rid of all logs means generating broken links in my past reviews, which could be an audit requirement stored with Gerrit changes.

Sending Jenkins data to a Logstash appender

It was about time for me to think about a solution and here is a description of what I have done.

First of all, I needed to get more disk space from Google, but then how can I tell Jenkins to use an alternative disk storage mechanism for his logs?
I then started adding to the jobs a plugin called “Logstash” (https://wiki.jenkins.io/display/JENKINS/Logstash+Plugin) which is responsible for capturing and sending Jenkins data to a configured stream appender.
All the Gerrit CI jobs are managed through YAML files which are submitted through code-reviews, using the Jenkins Job Builder tool. However, showing the Logstash configuration on the Jenkins UI is much easier to show where the Logstash is playing a role in the Gerrit-verifier-change job configuration.

Screen Shot 2017-10-24 at 23.05.33.png

I have enabled a new feature to all the jobs to send all the log stream to the Logstash plugin. This works differently to what most of the people would do. Instead of just posting the log file into a stream of lines to ElasticSearch, this plugin gets the information directly from the JVM memory together with its metadata, the timestamp, the build parameters, the environment variables and send them to an endpoint, which could be anything. In this case, I have chosen to use RabbitMQ as stream appender. On RabbitMQ you can notice that I have created a queue for incoming Jenkins messages.

Screen Shot 2017-10-24 at 23.07.02.png

You may notice a lot of activity because every time that the Jenkins jobs produce something, a message is sent to RabbitMQ with the log and the attached meta-data. RabbitMQ is not used though as a storage system but acts only as a vehicle to transfer the information to a long-term storage system, which could be Google Cloud Storage.

The organization of files is straightforward: one file per hour. By looking at the file content, it is a very compressed JSON file that contains all the information I need: the build id, the result, the logs, the parameters.

Spark to the rescue

Problem solved? Can I tell all the Gerrit contributors that they have to look for a build result into a JSON file? Maybe this is not a very nice user experience.
I little more digging is needed to make the solution more transparent to the end user.

Screen Shot 2017-10-24 at 23.14.56.png

GerritForge as a company works and contributes to many BigData projects, including Apache Spark. Why don’t we build an elementary Spark transformation that consumes the input JSON files and materializes back the log into a readable format?
So we built a Spark job that is crunching this data and produces something very very similar to what Jenkins would render. However, we need to make sure to perform all those operations outside the Jenkins domain; otherwise, it would become very soon overloaded and thus unusable.

I have then created another directory that is not actually managed by Jenkins but gets populated by a Spark job. This parallel file structure has exactly the same organization of the build files generated by Jenkins builds.
Let’s have a look for instance at the oldest build that has been recorded by Jenkins: build #31639. For sure if I go to the build #31444, which is older than the #31638, Jenkins would give me a 404 because that job execution has been removed.
However, if I try now to navigate to the build log #31444, wow, I can see the full results as the build log was still accessible.

Screen Shot 2017-10-24 at 23.09.09.png

Additionally, as this log has been produced from the previous JSON file that contains all the meta-data, I can even render more information such as the time-stamps, which are not typically available in Jenkins unless you enable a specific plugin.
Moving forward, by leveraging the same input JSON file, we could do a lot more data crunching as well. It would be interesting for instance to draw a graph of the correlation between the Gerrit changes the build execution times at the different stages.

Uncovering the hidden value of your Jenkins logs

There is a lot more we can do with the JSON I’ve shown you before. It contains not just the log messages, but everything related to the build meta-data of the build and its execution metrics. That means if we go to this change #129553, the link that points to Jenkins logs is not broken anymore, even if it is not served by Jenkins but is backed by the Spark job results.
Starting to applying the same mechanism to all the Gerrit changes and redirecting them to the Google storage where all the files are going to be archived, any change in the Gerrit history will not contain broken links anymore and will be perfectly auditable.

That means that from now, whenever you are going to receive a Verified notification from Gerrit and you navigate to your change links, you are not landing anymore to a 404 page anymore.

Questions.

Q: What if I have a Jenkins instance and I want to do some of this but I don’t have infinite disk-space as Google. Is it is possible to implement?

A: With regards to disk space, you don’t have to go to Google or AWS. You can set up an HDFS filesystem yourself. All the cloud storage implementations available on the Cloud are mainly based on something very similar to HDFS which is an open standard and is available as OpenSource. That means you can store the information there and you do not necessarily need to keep it forever. In practical terms what you need to keep is the lifetime of a release of the software, or a few software iterations, maybe six months, 12 months. As the JSON files are organized on a time-series, it is going to be very easy to remove or archive all the data you do not need anymore. I have shown you how to store those files in JSON, but you can use even more optimised and compressed format such as Avro or Parquet, which may contain 10x times the information in a fraction of disk space. Additionally, when you process them, they can be even faster because they include data encoded in binary format. In a nutshell, the term “keep the logs forever” could be read as “keep for as much as you need: one week, one month, six months, …”. The problem with Jenkins is that for very busy servers like the Gerrit CI, you cannot keep even a single day of logs and when the people are coming the next day to check what’s wrong with a failed verification, would risk having a 404 error page.

Q: So if you do compression and decompression, that needs to happen server-side, so that is transparent to the browser?

A: Yes, that needs to happen on the Server, and there are a lot of ways for doing it, it could be even done on-the-fly, streaming and is pretty fast. There will be a talk tomorrow talking about the methodology to crunch large amounts of data and about the lambda architecture.

Q: Does it generate a RabbitMQ message for each log statement or a unique one at the end of the build?

A: Yes, and the reason is straightforward: If the build crashes or gets aborted for any reason, you do not want to lose your build logs. There was an implementation of Logstash for the Jenkins pipeline that was precisely collecting the logs all at the end of the build, but the design is wrong because if the builds get aborted you do not get feedback at all. Yes, it generates a message for every single line, and possibly RabbitMQ is not the correct implementation of it. But as soon as the Logstash plugin supports the Kafka transport, the performance issues related to the use of RabbitMQ for log streaming will be resolved.

Q: The Logstash plugin that you mentioned, has nothing to do with the “ElasticLogstash” implementation?

A: Yes, it is just unfortunate naming. Actually, the Jenkins Logstash plugin was possibly born before Elastic called his implementation ‘logstash’.

Q: You mentioned that you do Spark processing at some point, but it wasn’t part of your presentation.

A: Yes, it is not part of this presentation for reasons of time, but it is trivial.

Q: Question about the GerritForge CI: I have frequent problems of the test failing not because of my code, and I want to retrigger the tests without having to add a commit to retrigger the CI. Is there a way to retrigger the CI build?

A: Yes, it can be done by going to the Gerrit-verifier-change URL, you click on “Build with Parameters” and enter your change number. You can in this way retrigger any build without having to commit anything.

Q: And if that pass that would assign the Verifier approval to the change?

A: Yes. I would like to add a Button to Gerrit-Review to avoid people to navigate to a different URL.

Q: We are relatively heavy users of Gerrit topics because we have changes that are across multiple repositories. We have a very similar job to this one but we can either put a single or multiple change IDs or a topic name, and it will work out whether it is a consistent declaration. Another thing that you can comment on, you mentioned that the verifier job which runs some independent verifications and then feeds the result as one result to Gerrit, that sounds like something we could use. What is that build using?

A: Tomorrow there will be a presentation of a brand-new integration between Gerrit and Jenkins. The rationale for writing a new integration lies on the thinking that “maybe the Gerrit project is not the only one that needs a bit more from Jenkins.” So why not creating a Jenkins plugin that takes the most of the experience we’ve made in integrating Gerrit with Jenkins for the Gerrit Code Review project and makes it available to the rest of the world? There will a plugin to implement that workflow.


Gerrit User Summit 2017, 2-3 Oct, London

GerritUserSummit2017-logo.png

New and exciting features are coming for this year Gerrit User Summit, with the launch of Ver. 2.15, NoteDb, high-availability, multi-master and much more.

The Summit will take place for the very first time in Europe, London, the location chosen by the community after a public consultation, the 2nd and 3rd of October at CodeNode (Skills Matter).

There are still a few places available but hurry up and register now at https://gerritusersummit.eventbrite.com.

See below an overview of the topics that will be presented and discussed during the User Summit.

What’s new in Gerrit 2.14.x.

Gerrit v2.14 was released during the last Hackathon in April and has gone through three patch releases. David Pursehouse from CollabNet will give an overview of the new features introduced which would be highly beneficial for all of those who haven’t migrated yet.

Gerrit at Google: Multi-master, Mutli-tenant.

Google is the founder, main contributor and possibly the most advanced user of the Gerrit Code Review: learning from their experience is a unique opportunity to learn and being able to leverage and use the tool at its best.

Patrick Hiesel from Google will go through the insights of their Gerrit Code Review architecture and will provide some of their metrics of scale. In addition to that, he will present some findings from the recent switch of their load-balancing infrastructure and the associated pitfalls encountered.

Google is possibly the only one in the world using Gerrit in a multi-tenant setup, having a unique multi-master installation that serves a constellation of domains and projects, including huge and familiar ones like Android and Chromium.

Standing “on the shoulders of giants” like Google helps a lot in preventing scalability issues as the audience and adoption of Gerrit Code Review grows in large companies: being part of the audience in the talk is a unique opportunity to learn and ask questions directly to the maintainers of their infrastructure.

PolyGerrit: a new UX experience for Gerrit Code Review

Google has invested a lot in reinventing and reengineering the user interface of Gerrit Code Review, which remained mostly unchanged for almost a decade. A new team has been put together in their San Francisco offices with experienced UX developers that leveraged the new Polymer framework of web components.

The result is PolyGerrit, a modern web UX which provides an unprecedented browsing speed and flexible rendering across different devices, including mobile and tablets.

The PolyGerrit Team will be presenting the findings of their user-experience research and show some of the features and insights of the new UX.

Gerrit CI and keeping logs forever.

Gerrit Code Review itself is a large project, involving over 300 developers across the globe and using the most advanced DevOps practices. The CI/CD pipeline has been provided and managed by GerritForge on the https://gerrit-ci.gerritforge.com and Luca Milanesio from GerritForge will present the latest improvements in the pipeline plus an interesting way of collecting and reusing the logs.

Leveraging the logs for identifying the bottlenecks of the CI/CD pipeline is the way to drive improvement. GerritForge leveraged the expertise of his engineers to harvest and organize data and will give it back to the community as powerful dashboards.

Beyond Gerrit.

Gerrit is great. However, it is also quite an important part of a bigger ALM process. Jacek Centkowski from CollabNet will describe how multiple tools can be unified under a single TeamForge umbrella and what are the immediate benefits of it.

What’s coming in Gerrit 2.15

After only four months, we are already close to the v2.15 of Gerrit Code Review, which would be possibly the last one before the step to the v3.0.

Dave Borowitz from Google, principal maintainer of the Gerrit Code Review project, will go through the new features of v2.15 and possibly give a glimpse in what to expect from v3.0.

Mining Gerrit Data to Study Contentious Reviews and Community Evolution

Gerrit Code Review is much more than a tool, it is a way for people working together in companies that are large and mostly distributed across the globe.

Shane McIntosh from McGill University has been running a research lab on this topic. The Software REBELs—a research lab at McGill University—mine code review data to study topics like the impact that code review practices have on software release and design quality. Our more recent work mines code review data to study the reviewing process itself. In this talk, I will describe the results of two empirical studies of data that we collected from the Gerrit instances of the OpenStack project. The first study aims to understand the reviews where reviewers disagree about a patch. The second study follows how the concerns that reviewers raise evolve as the OpenStack community ages and individual reviews accrue experience.

Gerrit Analytics: dashboards, networks, KPI

Gerrit has always been lacking major code analytics features compared to other Git Server tools like GitBlit or GitLab. GerritForge Ltd is filling the gap and adds one important asset to the Gerrit Code Review platform: code review analytics.

We need to harvest and unify the logs and events coming from the different components of the CI/CD pipeline by putting at the center of it the people and teams that are building and discussing the code on Gerrit. The resulting data-lake of information can be later analyzed and correlated to calculate the cycle time of the entire pipeline.

Luca Milanesio from GerritForge will show the new analytics dashboards that are going to be published and provided back to the Team that is developing the Gerrit Code Review project as a precious contribution to the community.

How to extend Gerrit using Scripting Plugins

Gerrit Code Review has a robust set of API that can be used to extend its functionalities and provide a more integrated development workflow for the Teams.

Luca Milanesio from GerritForge will present how to use different scripting tools to extend the capabilities of Gerrit without the need of developing and building a plugin, using Jython, Groovy and Scala.

A new simpler but powerful Gerrit Jenkins plugin

Gerrit Code Review is an essential part of a larger CI/CD pipeline. Most of the times it is used in conjunction with Jenkins, the most popular OpenSource Continuous Integration and Delivery tool.

The integration between Gerrit and Jenkins (Gerrit Trigger Plugin) was developed back in 2010 at Sony and since then has been extended and adopted in thousands of Jenkins installations. However, Jenkins has evolved too and has now a brand new concept and definition of multi-branch pipeline which struggles to be seamlessly integrated with the current Gerrit Trigger Plugin.

Luca Milanesio from GerritForge will present a brand new plugin based on the new Jenkins branch discovery API which works seamlessly with Jenkins multi-branch pipelines and provides a simpler interface with Gerrit by leveraging the new WebHooks.

Diffy with enterprise grade

Since 2012 CollabNet has been working on improving Gerrit integration with TeamForge. Many features have been created to satisfy the needs of enterprise customers. Eryk Szymanski from CollabNet will present features like RBAC, history protection, Git style notifications, quality gates, pull request and code browser which have been implemented on top of vanilla Gerrit.

Q&A with the maintainers

Have you ever wondered why something is working in a certain way? Have you ever wanted to explain any complaint about some parts of Gerrit? Would you give your congratulation to the people that made this project? Would you like to make a feature request or propose new ideas?

This is the moment where you can speak directly face-to-face to the people that are building this project every single day, the Gerrit maintainers.


The event is free for everyone, thanks to the contribution of our sponsors, CollabNet Inc, GerritForge Ltd and Skills Matter Ltd.

SponsorsBanner.png

GerritForge helps Gerrit 3.0 stability

Gerrit 3.0 plan announced: we need stabilisation now

Screen Shot 2015-11-23 at 09.52.19

Gerrit 3.0 plan and its NoteDB reviews have been officially announced at the Gerrit User Summit 2015. It is already available as an experimental feature in the current Gerrit master but it needs much more stability in order to be officially supported for production.
GerritForge decided to help and reuse its existing continuous integration system to validate every Gerrit patch set against the current and the new NoteDB review persistence back-end in order to avoid regressions during the 2.13 and 3.0 development

Pre-commit validation by GerritForge CI

If you have posted a patch to gerrit-review.googlesource.com in November, you may have hopefully received a Verified+1 from a strange user with a Diffy logo on the side.
GerritForge’s provided CI on gerrit-ci.gerritforge.com fetches automatically every patch-set pushed to gerrit-review.googlesource.com and triggers a slightly modified Gerrit build with the purpose of checking whether the code change introduces a regression or not. This may seem at first sight a quite normal Gerrit to Jenkins job integration, however implementing it on top of Google’s multi-master replicated installation was not a piece of cake.

Gerrit Trigger plugin limitations on multi-master setups

Jenkins has already an out-of-the-box integration with Gerrit provided by the Gerrit Trigger plugin maintained by Robert Sandell – Cloudbees. It leverages the Gerrit stream events through an SSH channel and make use of Gerrit REST API to action them according to the build result.
The Google’s Gerrit setup, however, is not a trivial one-node installation and is further limited by the security constraints of the Google infrastructure, which does not allow any incoming SSH connectivity.
Additionally all concept of “getting the events in a stream” isn’t going to work when events can come concurrently from multiple places at the same time: who is going to define the “global ordering” and how to put all those events in a single TCP/IP Socket? Even UDP would not work in this case because SSH channel requires confidentiality between two and only two peers.

Alternatives to SSH

During the hackathon, other approaches have been discussed by Shawn Pearce, including the use of HTTP WebSockets (or Cometd) for fetching events without the need of an SSH connection. Events are still distributed and generated by multiple masters all the time, and the Jenkins plugin would then have the onus of contacting all the Gerrit servers and keep a connection opened to all of them. This is clearly not going to work because the number of servers, their IPs and locations may change at any time and the solution would eventually be in danger of losing precious events.

Back to polling

The only solution we envisaged was to fall back to a polling logic where Jenkins ever 10 minutes is asking Gerrit “what’s new since last time we spoke?”. This solution goes against the main reason the Gerrit Trigger plugin was designed: avoiding SCM polling. It is, however, a much better and optimised polling strategy and let’s see why.

Query and then fetch

The typical Git SCM polling relies on fetching all references every poll interval and detect if new Git commits are available. This is notably slow and generates a huge overhead on the Git server. The approach we took is quite different and makes use of the Gerrit search capabilities that are way faster and more powerful than a simple Git fetch.
Jenkins first ask Gerrit the list of changes and associated commit-IDs involved in any event since the last polling time: the result may include patchsets that have been already built to avoid having any gaps between polling intervals. The search is fast and implemented in … you know, Google is a search company isn’t it?
Once the list of candidate commit-ids is identified, Jenkins goes through all of them and checks using the Gerrit REST-API:
– has it been build during my previous execution?
– has it been already accepted (or rejected) by me?
The Commit-IDs that results as not being checked before and not yet validated are then used to trigger a specific job parametrised on:
– Specific branch
– Specific change ref-spect
Fetching is performed avoiding any wildcard and the corresponding load on the Git server is minimum. Fetch (Git protocol) + build (using Buck) + test (unit + integration) + review feedback (REST API) is taking an average of 5 minutes, which is an amazing result if you consider the size of the Gerrit project and the typical slow speed of a default Jenkins Git fetch.

The bottom line

Using the query + fetch approach, which seemed a bit slow and old-fashioned at the beginning, was eventually very simple and successful. Instead of setting up SSH hostkey verification, key exchange and ad-hoc channels, the only configuration needed is a valid Gerrit user and the HTTPS endpoint URL, the same used for cloning the code.
The solution is much more reliable as SSH channels are notably unstable and consume server threads. The only drawback is the slight delay between the patch-set upload the start of the build (at max 10 minutes) which is acceptable in most cases.
Results
Since its roll-out more than 1200 patches have been checked and rated, a lot of potentially Gerrit regression avoided and more importantly we have prevented the NoteDB code to start diverging regarding stability from the current mainstream development.

How can re-trigger validation for a single change?

We have enabled anyone to trigger ad-hoc executions of the Gerrit validation flow using the following URL:
https://gerrit-ci.gerritforge.com/job/Gerrit-verifier-flow/build
This is a standard Jenkins parametrized build that request the change-id to be built, as either SHA1 or number. Once the job is triggered the build will be executed and the validation feedback applied to your change, regardless of the previous build or validation status.

Gerrit Code Review and Jenkins Continuous Delivery Pipeline on BigData

Gerrit at the Jenkins User Conference 2015 – London

For the very first time, CloudBees organised a full User Conference in London and we have been very pleased to speak to present a real-life case-study of Continuous Integration and Continuous Delivery applied to a large-scale BigData Project.

See below a summary of the overall presentation published on the above YouTube video.

The trap of the BigData production phase

BigData has been historically used by data scientists in order to analyse data and extract  features that are relevant for the business. This has typically been a very interactive process happing mostly on “notebook-style” environments where almost everything, from ad-hoc queries and graphs, could have been edited and executed interactively. This early stage of the process is typically known as “exploration” or “prototype analysis” phase. Sometimes last only a few days but often is used as day-by-day modus operandi.

However when the exploration phase is over, projects needed to be rewritten or adapted using a programming language (Scala, Python or Java) and transformations and aggregations expressed in jobs. During the “production-isation” phase code needs to be properly written and tested to be suitable for production.

Many projects fall into the trap of reducing the “production phase” to a mere translation of notebooks (or spreadsheets) into Scala, Java or Python code, relying only on the manual analysis of the resulting data as unique testing methodology. The lack of software engineering practices generates complex monolithic code,  difficult to maintain, to understand and thus to validate: the agility of the initial “exploration” phase was then miserably lost in the translation into production code.

Why Continuous Delivery on BigData?

We have approached the development of BigData projects in a radically different way: instead of simply relying on existing tools, often not enough for setting up a proper Agile Delivery Pipeline, we introduced brand-new frameworks and applied them to the building blocks of a Continuous Delivery pipeline.

This is how Stefano Galarraga wrote started the ScaldingUnit project, aimed in de-composing the development of complex Scalding MapReduce jobs in simple and testable units.

We started then to benefit from the improved Agility and speed of delivery, giving constant feedback to data-scientists and delivering constant value to the Business stakeholders during the production phase. The talk presented at the Jenkins User Conference 2015 is smaller-scale show-case of the pipeline we created for our large clients.

Continuous Delivery Pipeline Building Blocks

In order to build a robust continuous delivery pipeline, we do need a robust code-base to start with: seems a bit obvious but is often forgotten. The only way to create a stable code-base,  collectively developed and shared across different [distributed] Teams, is to adopt a robust code review lifecycle.

Gerrit Code Review is the most robust and scalable collaboration system that allows distributed teams to submit their changes and provide valuable feedback about the building blocks of the BigData solution. Data scientists can participate as well during the early stage of the production code development, giving suggestions and insight on the solution whilst is still in progress.

Docker provided the pipeline with the ability to define a set of “standard disposable systems” to host the real-life components of the target runtime, from Oracle to a BigData CDH Cluster.

Jenkins Continuous Integration is the glue that allowed coordinating all the different actors of the pipeline, activating the builds based on the stream events received from Gerrit Code Review and orchestrating the activation of the integration test environments on Docker.

Mesos and Marathon managed all the physical resources to allow a balanced allocation of all the Docker containers across the cluster. Everything has been managed through Mesos / Marathon, including the Gerrit and Jenkins services.

Pipeline flow – Pushing a new change to Gerrit Code Review

The BigData pipeline starts when a new piece of code is changed on the local development environment. Typically developers test local changes using the IDE and the Hadoop “local mode” which allows the local machine to “simulate” the behaviour of the runtime cluster.

The local mode testing is typically good enough for running unit-tests but often is unable to detect problems (e.g. non-serialisable objects, compression, performance) that are likely to appear in the target BigData cluster only. Allowing to push a code change to a target branch without having tested on a real cluster represent a potential risk of breaking the continuous delivery pipeline.

Gerrit Code Review allows the change to be committed and pushed to the Server repository and built on Jenkins Continuous Integration before the code is actually merged into the master branch (pre-commit validation).

Pipeline flow – Build and Unit-tests execution

Jenkins uses the Gerrit Trigger Plugin to fetch the code currently under review (which is not on master but on an open change) and triggers the standard Scala SBT build. This phase is typically very fast and takes only a few seconds to complete and provide the first validation feedback to Gerrit Code Review (Verified +1).

Until now we haven’t done anything special of different than a normal git-flow based continuous integration: we pushed our code and we got it validated in Jenkins before merging it to master. You could actually implement the pipeline until this point using GitHub Pull Requests or similar.

Pipeline flow – Integration test automation with a real BigData Cloudera CDH Cluster

Instead of considering the change “good enough” after a unit-test validation phase and then automatically merging it, we wanted to go through a further validation on a real cluster. We have completely automated the provisioning of a fully featured Cloudera CDH BigData cluster for running our change under review with the real Hadoop components.

In a typical pipeline, integration tests in a BigData Cluster are executed *after* the code is merged, mainly because of the intrinsic latencies associated to the provisioning of a proper reproducible integration environment. How then to speed-up the integration phase without necessarily blocking the development of new features?

We introduced Docker with Mesos / Marathon to have a much more flexible and intelligent management of the virtual resources: without having to virtualise the Hardware we were able to spawn new Docker instances in seconds instead of minutes ! Additionally the provisioning was coordinated by the Docker Build Step Jenkins plugin to allow the orchestration of the integration tests execution and the feedback on Gerrit Code Review.

Whenever an integration test phase succeeded or failed, Jenkins would have then submitted an “Integrated +1/-1” feedback to the original Gerrit Code Review change that triggered the test.

Pipeline flow – Change submission and release

When a change has received the Verified+1 (build + unit-tests successful) and Integrated+1 (integration-tests successful) is definitely ready to be reviewed and submitted to the master branch. The additional commit triggers the final release build that tags the code and uploads it to Nexus ready to be elected for production.

Pipeline flow – Rollout to production

The decision to rollout to production with a new change is typically enabled by a continuous delivery pipeline but manually operated by the Business stakeholders. Even though we could *potentially* rollout every change, we did not want *necessarily* do that because of the associated business implications.

Our approach was then to publish to Nexus all the potential *candidates* to production and roll-them-out to a pre-production environment, ready to be assessed by Data-Scientists and Business in real-time. The daily job scheduler had a configuration parameter that simply allowed to “pointing” to the version of the code to run every day. In this way whatever is deployed to Nexus is potentially fully working in production and rollout or rollback a release is just a matter of changing a label in the daily job scheduler.

Summary

Building a Continuous Delivery Pipeline for BigData has been a lot of fun and improved the agility of the Business in rolling out changes more quickly without having to compromise on features or stability.

When using a traditional Continuous Integration pipeline, the different stages (build + unit-test, integration-tests, system-tests, rollout) are all happening on the target branch causing it to be amber or red at times: whenever tests are failing the pipeline need to be restarted from start and people are blocked.

By adopting a Code Review-driven Continuous Integration Pipeline we managed to get the best of both worlds, avoiding feature branches but still keeping the ability to validate the code at each stage of the pipeline and reporting it back to the original change and the associated developer without to compromise the stability of the target branch or introducing artificial and distracting feature branches.

Resources

The slides of the talk are published on SlideShare.

All the docker images used during the presentation are available on GitHub: