Gerrit User Summit: Jenkins forever

This week we are going to publish a talk from the Gerrit User Summit 2017 about Gerrit and Jenkins used together. It is a real-life story on how to set up a CI/CD pipeline for a massive traffic OpenSource project such as Gerrit Code Review and the learnings of how to manage the storage and consumption of the Jenkins build logs and the associated meta-data.

Even if you are not a Gerrit Code Review user, the learnings of this talk are going to be exciting and useful for any high load CI/CD pipeline project with Jenkins.

GerritForge: Gerrit Code Review and Jenkins expertise

I am part of GerritForge, a London-based limited company not specialized in Gerrit, as the name would tell, but also on Jenkins, Continuous Integration and Delivery. Why don’t we use our skills to serve the Gerrit Code Review project? A couple of years ago the project did not have an official CI yet, so we said: “why not help the project and set up an official pipeline to verify all the incoming Gerrit changes to the Gerrit Code Review project itself?”

We then created https://gerrit-ci.gerritforge.com and, as you can see, it is nowadays a jam-packed CI system. We have been running a Hackathon over the weekend, and now, even while people in this room are following this talk, new changes are produced, and reviews are getting pushed to Gerrit, and that keeps our CI busy all the times.

Screen Shot 2017-10-24 at 22.51.04.png

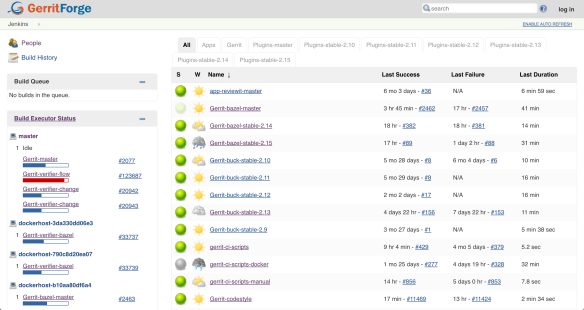
We have a lot of slaves, some of them are provided for free by Google and others are paid by GerritForge. We have been running this service for the last couple of years, and even non-contributors to the Gerrit project like most of you guys are possibly using it for downloading some useful artifacts such as the Gerrit plugins. Additionally, if you want to download and demo the latest and greatest version of Gerrit master, as we just did with some of you before lunch, you can use the Gerrit artifacts on Gerrit-CI instead of building it yourself on your local box.

Gerrit-CI pipeline walkthrough

Let’s have a look at how Gerrit-CI works. You can log in with your GitHub credentials, and then trigger builds for your Gerrit Code Review contribution using a job called “Gerrit verifier change”. That is the most important job of the pipeline and it verifies every single change we make on the Gerrit Code Review project.

How can you manually trigger the build and verification of a change in Gerrit? You navigate to https://gerrit-ci.gerritforge.com/job/Gerrit-verifier-change/ and click on “Build with parameters” link. You enter your change number and then click “Build”: it is straightforward.

What this job does is triggering a workflow developed in Groovy language which it will provide at the end a series of feedback messages to Gerrit. When you go to https://gerrit-review.googlesource.com and list of open changes, you will notice that some of them by one guy that is called “GerritForge CI”. That means that our CI works, yeah!

houston1.jpg

At a certain point in time, someone in the Gerrit mailing list said: “Houston, we have a problem, we are too productive! We have produced so many changes and patch sets that the time you finish to build a change, we have already produced other 300 patch sets on that job and the build logs get lost”.

The Gerrit change verifier workflow

Let’s go back for a moment to review how the workflow that we came up with works. It does not rely on the Gerrit Trigger plugin, the de-facto out-of-the-box Gerrit/Jenkins integration that most of the people use, but rather on a complete “new thing” that we have built ad-hoc for our purpose.
We couldn’t use the Gerrit Trigger plugin because of two reasons:

  1. Google data-centers do not allow incoming SSH connections
  2. SSH stream event channel would not have been good enough for us, because of the parallelism needed.

The way that our workflow works if very simple.
The verifier flow requests the list of changes that need verification by leveraging Gerrit query language which allows you to search through most of the fields of changes using a Lucene syntax. For each change that needs checking, a corresponding number of parallel jobs are triggered. This parallelism is potentially unlimited; the only limit is the number of machines that Google can assign to the Gerrit-CI, if he can allocate one hundred, we will be able to perform hundreds of parallel changes verifications.

Screen Shot 2017-10-24 at 22.53.30.png

That means that we can produce a lot of verification jobs at the same time. Bear in mind that for every change we do not trigger just one build: we have NoteDb vs. ReviewDb verification, PolyGerrit UX tests, Code-Style check there was a moment in time where a single change needed up to 6 parallel builds! That resulted into a lot of builds, which, as long as you’ve got enough horsepower in the slaves, it was working fine us.

We do not send feedback to Gerrit for every single build, but we rather have a “Gerrit Verifier Change” job coordinating the workflow and makes a decision accordingly. The criteria are the number of failed builds, the build retries for flaky builds. At the end of the process, all build results are collected and a unique coordinated feedback to send back to Gerrit as a unique verification message.

Too many logs for Jenkins lead to a 404 page.

This is all good, but as we said earlier: “Houston, we have a problem, we are too productive!”.
Here are some numbers of our productivity:

  • 300 jobs
  • 170,000 builds
  • 4.8 millions of jar artifacts produced
  • 1.7 billions of lines of logs

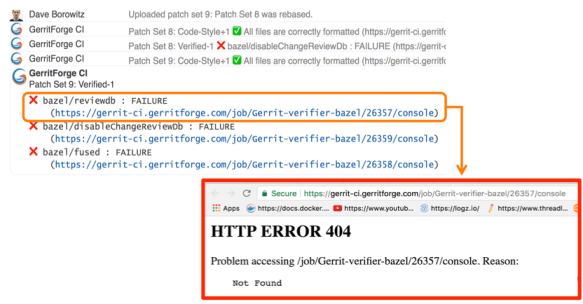
And of course, we want to send a link to the build logs we want to give context to the change failure or success. Unfortunately, happened to trace in Gerrit changes some nice links pointing to a quite unpleasant 404 page in Jenkins.

Why did it happen? We have a lot of contributors that generated lots of commit traffic and thus many build runs. There is a policy in Jenkins to remove “old” builds and thus happened that we lost build logs of active changes under review.

Screen Shot 2017-10-24 at 22.59.39.png

Q. (Han-Wen Nienhuys – Google) At Google internal build system we also this kind of numbers but of course with more zeros at the end, but actually we throw away our logs, and if you build binaries, they are very large.

In the beginning, we tried to keep more stuff online in Jenkins but people started saying “Luca, we have a much bigger problem now: gerrit-ci.gerritforge.com doesn’t respond anymore. When I open the Jenkins home page, it takes a very long time and eventually times out.”

That is caused by Jenkins design which is problematic when the number of logs increases considerably: everything is stored as a file and there is no efficient indexing for discovering the data on the filesystem. Additionally, if your company does not have a large infrastructure, your disk space is limited anyway. At GerritForge the Jenkins master has only 8TBytes of disk space, and we don’t have available a system with PetaBytes or more.

Keeping Jenkins logs forever

I made the Gerrit Contributors’ Community aware of the problem and I asked: do we like that? If you think about it, logs are not rubbish. Logs are of immense value, logs are like your money, and analyzing them, crunching and understanding them is our daily job. The timestamps in the logs are like precious diamonds because they tell you that you may have made a mistake in your code and some parts of your pipeline execution start taking a lot more time than before.

When you remove the “old” logs, you make much more difficult to investigate on a failed verification build: the link attached to the change verification message points to a page that returns a 404. That’s not a bug in Jenkins; it’s a feature of removing old logs and keeping the master instance fast and healthy. But actually, it is a real functionality gap because Jenkins doesn’t know yet how to manage logs archiving.

Then I asked the Community: “For how long you want your logs to be retained?” because I needed to raise a PO for a much bigger machine. “One day, one week, one month?” and the answer I got was “Forever!”

If you think about it carefully, the answer is correct. You may not need all those logs at the moment, but in a month’s time, you may need to crunch some data to extract features or metrics. Additionally, getting rid of all logs means generating broken links in my past reviews, which could be an audit requirement stored with Gerrit changes.

Sending Jenkins data to a Logstash appender

It was about time for me to think about a solution and here is a description of what I have done.

First of all, I needed to get more disk space from Google, but then how can I tell Jenkins to use an alternative disk storage mechanism for his logs?
I then started adding to the jobs a plugin called “Logstash” (https://wiki.jenkins.io/display/JENKINS/Logstash+Plugin) which is responsible for capturing and sending Jenkins data to a configured stream appender.
All the Gerrit CI jobs are managed through YAML files which are submitted through code-reviews, using the Jenkins Job Builder tool. However, showing the Logstash configuration on the Jenkins UI is much easier to show where the Logstash is playing a role in the Gerrit-verifier-change job configuration.

Screen Shot 2017-10-24 at 23.05.33.png

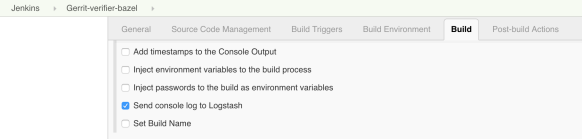
I have enabled a new feature to all the jobs to send all the log stream to the Logstash plugin. This works differently to what most of the people would do. Instead of just posting the log file into a stream of lines to ElasticSearch, this plugin gets the information directly from the JVM memory together with its metadata, the timestamp, the build parameters, the environment variables and send them to an endpoint, which could be anything. In this case, I have chosen to use RabbitMQ as stream appender. On RabbitMQ you can notice that I have created a queue for incoming Jenkins messages.

Screen Shot 2017-10-24 at 23.07.02.png

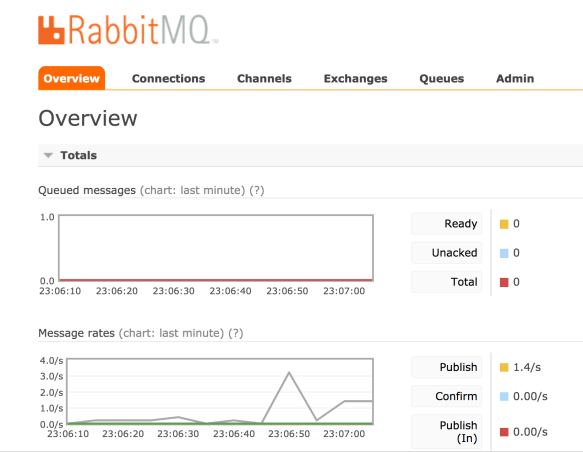
You may notice a lot of activity because every time that the Jenkins jobs produce something, a message is sent to RabbitMQ with the log and the attached meta-data. RabbitMQ is not used though as a storage system but acts only as a vehicle to transfer the information to a long-term storage system, which could be Google Cloud Storage.

The organization of files is straightforward: one file per hour. By looking at the file content, it is a very compressed JSON file that contains all the information I need: the build id, the result, the logs, the parameters.

Spark to the rescue

Problem solved? Can I tell all the Gerrit contributors that they have to look for a build result into a JSON file? Maybe this is not a very nice user experience.
I little more digging is needed to make the solution more transparent to the end user.

Screen Shot 2017-10-24 at 23.14.56.png

GerritForge as a company works and contributes to many BigData projects, including Apache Spark. Why don’t we build an elementary Spark transformation that consumes the input JSON files and materializes back the log into a readable format?
So we built a Spark job that is crunching this data and produces something very very similar to what Jenkins would render. However, we need to make sure to perform all those operations outside the Jenkins domain; otherwise, it would become very soon overloaded and thus unusable.

I have then created another directory that is not actually managed by Jenkins but gets populated by a Spark job. This parallel file structure has exactly the same organization of the build files generated by Jenkins builds.
Let’s have a look for instance at the oldest build that has been recorded by Jenkins: build #31639. For sure if I go to the build #31444, which is older than the #31638, Jenkins would give me a 404 because that job execution has been removed.
However, if I try now to navigate to the build log #31444, wow, I can see the full results as the build log was still accessible.

Screen Shot 2017-10-24 at 23.09.09.png

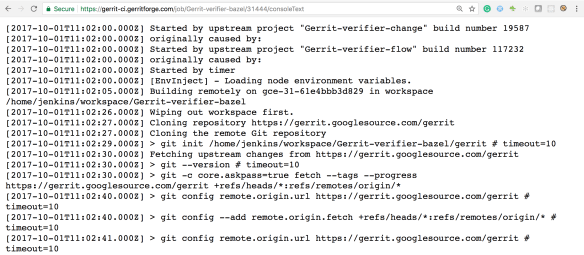
Additionally, as this log has been produced from the previous JSON file that contains all the meta-data, I can even render more information such as the time-stamps, which are not typically available in Jenkins unless you enable a specific plugin.
Moving forward, by leveraging the same input JSON file, we could do a lot more data crunching as well. It would be interesting for instance to draw a graph of the correlation between the Gerrit changes the build execution times at the different stages.

Uncovering the hidden value of your Jenkins logs

There is a lot more we can do with the JSON I’ve shown you before. It contains not just the log messages, but everything related to the build meta-data of the build and its execution metrics. That means if we go to this change #129553, the link that points to Jenkins logs is not broken anymore, even if it is not served by Jenkins but is backed by the Spark job results.
Starting to applying the same mechanism to all the Gerrit changes and redirecting them to the Google storage where all the files are going to be archived, any change in the Gerrit history will not contain broken links anymore and will be perfectly auditable.

That means that from now, whenever you are going to receive a Verified notification from Gerrit and you navigate to your change links, you are not landing anymore to a 404 page anymore.

Questions.

Q: What if I have a Jenkins instance and I want to do some of this but I don’t have infinite disk-space as Google. Is it is possible to implement?

A: With regards to disk space, you don’t have to go to Google or AWS. You can set up an HDFS filesystem yourself. All the cloud storage implementations available on the Cloud are mainly based on something very similar to HDFS which is an open standard and is available as OpenSource. That means you can store the information there and you do not necessarily need to keep it forever. In practical terms what you need to keep is the lifetime of a release of the software, or a few software iterations, maybe six months, 12 months. As the JSON files are organized on a time-series, it is going to be very easy to remove or archive all the data you do not need anymore. I have shown you how to store those files in JSON, but you can use even more optimised and compressed format such as Avro or Parquet, which may contain 10x times the information in a fraction of disk space. Additionally, when you process them, they can be even faster because they include data encoded in binary format. In a nutshell, the term “keep the logs forever” could be read as “keep for as much as you need: one week, one month, six months, …”. The problem with Jenkins is that for very busy servers like the Gerrit CI, you cannot keep even a single day of logs and when the people are coming the next day to check what’s wrong with a failed verification, would risk having a 404 error page.

Q: So if you do compression and decompression, that needs to happen server-side, so that is transparent to the browser?

A: Yes, that needs to happen on the Server, and there are a lot of ways for doing it, it could be even done on-the-fly, streaming and is pretty fast. There will be a talk tomorrow talking about the methodology to crunch large amounts of data and about the lambda architecture.

Q: Does it generate a RabbitMQ message for each log statement or a unique one at the end of the build?

A: Yes, and the reason is straightforward: If the build crashes or gets aborted for any reason, you do not want to lose your build logs. There was an implementation of Logstash for the Jenkins pipeline that was precisely collecting the logs all at the end of the build, but the design is wrong because if the builds get aborted you do not get feedback at all. Yes, it generates a message for every single line, and possibly RabbitMQ is not the correct implementation of it. But as soon as the Logstash plugin supports the Kafka transport, the performance issues related to the use of RabbitMQ for log streaming will be resolved.

Q: The Logstash plugin that you mentioned, has nothing to do with the “ElasticLogstash” implementation?

A: Yes, it is just unfortunate naming. Actually, the Jenkins Logstash plugin was possibly born before Elastic called his implementation ‘logstash’.

Q: You mentioned that you do Spark processing at some point, but it wasn’t part of your presentation.

A: Yes, it is not part of this presentation for reasons of time, but it is trivial.

Q: Question about the GerritForge CI: I have frequent problems of the test failing not because of my code, and I want to retrigger the tests without having to add a commit to retrigger the CI. Is there a way to retrigger the CI build?

A: Yes, it can be done by going to the Gerrit-verifier-change URL, you click on “Build with Parameters” and enter your change number. You can in this way retrigger any build without having to commit anything.

Q: And if that pass that would assign the Verifier approval to the change?

A: Yes. I would like to add a Button to Gerrit-Review to avoid people to navigate to a different URL.

Q: We are relatively heavy users of Gerrit topics because we have changes that are across multiple repositories. We have a very similar job to this one but we can either put a single or multiple change IDs or a topic name, and it will work out whether it is a consistent declaration. Another thing that you can comment on, you mentioned that the verifier job which runs some independent verifications and then feeds the result as one result to Gerrit, that sounds like something we could use. What is that build using?

A: Tomorrow there will be a presentation of a brand-new integration between Gerrit and Jenkins. The rationale for writing a new integration lies on the thinking that “maybe the Gerrit project is not the only one that needs a bit more from Jenkins.” So why not creating a Jenkins plugin that takes the most of the experience we’ve made in integrating Gerrit with Jenkins for the Gerrit Code Review project and makes it available to the rest of the world? There will a plugin to implement that workflow.


Gerrit User Summit: Gerrit at Google

Starting from this week, we are going to share one video per week of the amazing talks that were presented at the Gerrit User Summit 2017 in London.

In addition to the YouTube recording, we are during the extraction of the text and publishing it together with the relevant pictures taken from the presenter’s slides, so that people can start digesting the content at small bites.

This week talk is Patrick Hiesel’s presentation on how Gerrit multi-tenant and multi-master setup has been implemented in Google.

Gerrit@Google – Patrick Hiesel, Google

My name is Patrick, and I am going to talk about the setup of Gerrit we are running at Google. I wanted to take you on a journey starting with Gerrit that you all know and making it the system we run at Google, step-by-step; and at the end will have a multi-master and multi-tenant system.

Multi-what?

Multi-tenant is the ability to serve multiple hosts from the same single Java process. Imagine like the same JVM task serving gerrit-review.googlesource.com and gerrit-chromium.googlesource.com.

Multi-master is the ability to have multiple Gerrit servers all over the world. You can contact any one of them for reads and writes.
Most systems have read replicas, which is straightforward, but write replicas is where the juicy meat is.

Multi-tenant

We have gerrit-review.googlesource.com, based on OpenSource Gerrit that you can download right now and have it running hopefully under ten minutes. That is core-Gerrit, and it depends on three things:

  1. JGit: for all the Git stuff
  2. Multiple indexes for the accounts, changes, and other stuff
  3. Caches

All these three components are based on the filesystem in one way or the other.

Now you have a friend that is accessing go-review.googlesource.com, what are you going to do?
The most natural solution is to start another Gerrit instance for it. You can have all of them on one machine, you can give them different ports, very easy, and in the end, they’ll be all based on the filesystem.
All those Gerrit instances do not need to talk to each other; they can just be separate instances operating on separate ports. This is not a multi-tenant system, but only different Gerrit instances on the same host.

Screen Shot 2017-10-10 at 15.35.08.png

You can add another layer on top of it: a servlet engine which receives all the traffic, check which host the traffic is for, and just delegate to the individual host.
To take one step further, have that selection filter doing that for you. Gerrit has a daemon that runs all the functionalities. You can integrate that daemon into the incoming servlet filter. When you can get a request for go-review.googlesource.com and I do not have where to allocate it, you can just launch it, instantiate all the objects and then run the traffic from there. Also, unload instances would work in the same way.
The Gerrit server engine and the selection filter can run in a single JVM.

How Gerrit can conquer the world

So you have a master here in Europe, and you have got one friend on the west coast in the US. He says: “Oh your Gerrit is so slow I have no idea why and I wish I could move to GitHub.” You say: “Hold on, I can do better than that!” and so you put a new master for the person on West coast.

So the key to that is the replication and comes in two sets:

  • Objects that you have to replicate related to all the Git data. JGit is putting objects into the disk, and these are the data you need to replicate correctly and fast.
  • Other stuff that should replicate and fast to provide a pleasant user experience but it really can be best-effort. That is the indexes and the caches.

If it is okay for your master having a 200/600 msec additional latency, then do not replicate the caches. You can have a cold cache in Singapore or the US, and you can reread them without problems.

Screen Shot 2017-10-10 at 15.37.31.png

For the index, replication can be best-effort, but you should make an effort to replicate them. It is still nonetheless a mandatory requirement. One way to achieve that is to use ElasticSearch, but other index implementations that give indexes replication can be used as well.

Multi-tenant and Multi-master together

We talked about a multi-tenant system and then replicate them globally, so we have now a multi-tenant and multi-master system, actually pretty close to what we run at Google.

That is the stack that we run in total. We have a selection filter and two other filters to decide what the traffic is directed. We are also based on JGit, no magic there, we have index and caches we replicate, all our systems are based on filesystem and BigTable.

Some “magic” happens at the Git layer at Google because that is where all the majority consensus across all the cells. When you are pushing anything that is Git and, with NoteDb, anything that is a review is in the repository as well, the system tries to reach the majority of the cells and write the objects to them. When that is acknowledged, you get a green light on the push.
Majority consensus also means that you have it only in so many cells, but don’t have it on all the cells all the times. Some of the replication is happening in the long tail, by replication events eventually get acknowledged by the cells, and then they get written to all the masters.

Our indexes and caches are also replicated, but some of them are just in-memory and a component that gets replicated on top of BigTable.

Redundancy everywhere.

We run five data-centers across three continents (Americas, Europe, Asia-Pacific), with precisely the stack we just saw which gives us a good latency for most of our users worldwide.

Let’s talk about load balancing. We have a system that is multi-master and multi-tenant, and any of the tasks can serve any requests, but just because it can, doesn’t mean that it should.
Maybe it has in cold memory caches, or it is in Singapore, and you are in the US; so the question is what if the biggest machine is not big enough and we want to optimize it?

Screen Shot 2017-10-10 at 15.39.02.png

The idea is that we want to reduce latency that comes out of cold caches and minimize the time the site takes to load.
So you have a request for gerrit-review.googlesource.com, and your instance has a cold cache, and you need to read from disk to memory to serve the request.
You have a fleet of 300 tasks available but you want to serve gerrit-review.googlesource.com from only just five of them. If you serve 300 requests from 300 tasks in a round-robin manner, you pay the latency to load data from disk to memory for every single request. And the second motivation is that you want to distribute the load.

We want a system that can dynamically scale with changing load patterns. We want a system that can optimise the caches, to send a request for a site/repo to the few number of servers and tasks based on two conditions:

  1. serve from one machine as long as it fits on it
  2. server from more machines if you really have to

Level-1 load balancer

In the stack at Google, you saw two load balancing levels. What you see down in the picture is the Gerrit tasks, that contains all the software layers we talked about. We have a user that triggers JSON calls from the browser, with PolyGerrit. The first thing that the JSON request is hitting is the L1 load balancer. The primary routing of your request is by geographic proximity. We have five datacentres at Google; the L1 load balancer picks the one with the lowest latency. When the request goes into the data-center, we have another load balancer which is the one I’ll talk about more, because this is the one where the Gerrit specifics happen.

One thing that L1 is doing as well is managing the spillover of traffic. When a datacentre says “I can handle up to 100 QPS” the L1 load balancer starts redirecting traffic to other datacentres should that threshold be reached.

Level 2 load balancer

Let’s dive into L2 load balancer, we want to know how much traffic we are getting into each Gerrit task, and we want to know in the load balancer where the single request should go, and we want to know that fast!

We added three new components to the architecture:

  • An element to redirect tasks and provide functionality and can report the load we are handling right now. When I mean load it can be anything: QPS (Queries Per Second), metrics, we just want to know from the tasks: what is your current load? We have a system called slicer, which I am going to talk about in a second and it’s added there in the picture.
  • A second component we are adding to the load balancer, with a query interface that responds to the following question: “we have a request for gerrit-googlesource.com, where should it go?”. All of that should be done in memory and should be regularly updated with the new elements in the background so that we don’t add another component of latency by having another RPC.
  • A third part is coordinating everything and is called the assigner, and it takes all the load metrics that we reported generates new assignments and gives them to the query interface.

Introducing the slicer

We have a system that is called slicer. There is a very nice paper that I can recommend, published last fall, that talks about that. It is a load balancer that works on custom keys and can do automatic re-sharding based on new traffic patterns. When your nodes receive more traffic, the slicer will automatically distribute the load or re-shard the whole system. That is a suitable method for local sharding that happens within the data center; we do not use it for inter-datacentre because that is all done via geographic proximity.

Screen Shot 2017-10-10 at 15.40.13.png

The system works with 64-bit keys and gives you a lot of combinations. You can slice the keyspace, for instance, in 400 slices. That gives you 400 ranges, and you can take any of them and assign to one or more tasks. The hostname is my key for instance, and then you hash it, and you end up in the first slice that gets assigned to a single task with an index zero.

What can we do if the load changes? Let’s say that you have key zero that gets assigned to the first range and then the traffic changes. We have two options.

  1. The first option is to assign more tasks, let’s say task 6, and then you round-robin between task 0 and task 6.
  2. The second option is splitting into 600 or 800 slides to get a better grip on each of the keys.

Screen Shot 2017-10-10 at 15.41.20

We can also do that, and then we factor our the load for gerrit-review.googlesource.com and go-review.googlesource.com, and we put them into different hosts.

We do that for Gerrit, and one of the things we want for Gerrit is when we have to split per-host traffic with the affinity on the repository. Caches are based on the project, and because gerrit-android.googlesource.com is a massive host served from a lot of tasks, we don’t want all these tasks just to serve all general traffic for android. We want tasks serving android/project1 from here and android/project2 from there so that we optimise the second layer of caches.

What we do is to mangle these keys together based on both host and project. Before, all these chromium keyspace was served from a single host; when the load increases we just split the keys into Chromium source and the rest of metadata. This is the graph that we obtained after we implemented the load balancer. The load we have on each of the tasks in a single data center is represented by a line with a different color. What you can see is that are all nicely aligned, so that each task is serving precisely the same amount of traffic which is what you want.

Screen Shot 2017-10-10 at 15.42.21.png

What if one project is 100 times the size of the others and we are optimizing on queries per second? The system will just burn resources fast. We had that situation in May, we saw the graphs, and we said “all good, looks nice”; however, people were sending e-mails and raising bugs wondering if the system were serving any traffic at all or if it were down completely.
It turned out that Android had a lot of large repositories, regarding the number of references, and the objects. We were just optimizing the queries per second, but some of the tasks were doing just CPU intensive work, where others were happy with it. Some of them were burning CPU in flames, and others were fine.

So we moved out of the per-request affinity, and we modified the per-repository sharding to optimise all of this.

Warm vs. Cold Cache

There is an extra in the system that is pre-warming caches. What the load balancer can do for you is to tell you that traffic is changing and I need to reconsider how to split the load on the system. For each of the tasks is going to tell “I’m going to give you traffic for gerrit-review.googlesource.com” with a notice of 30 seconds. That time you can use for pre-warm caches.

That is especially nice if you restart your tasks because all the associated in-memory cache gets flushed. The load balancer tells you “oh, this is the list of the tasks I need” and then you can get them all and pre-warm their caches. This graph shows the impact of the cache warmer on our system, on the 99.9% requests latency, really on the long tail of requests latency. That looks nice because we brought the latency down by a third.

Screen Shot 2017-10-10 at 15.43.15.png

What is a task start dying during peak traffic? Imagine that the load balancer is saying “You’re going to handle this” and two seconds later says “I have to reconsider, you’re going to handle that instead”. Again you’re going to watch your system burning on fire, because you’re serving peak traffic and then you’re running close to 100% CPU. That situation causes the load balancer loading and unloading tasks all the time, which is inconvenient. The way we work around this is to make this cache warming a best-effort activity. You can do it if you’re below 50% CPU when you have time to do fancy things, but when you receive peak traffic, you just handle peak traffic without any optimisation made.

Multi-master and multi-tenant outside of Google

The question is: how do we do that in a non-Google setup?
There are plenty of options.

With the new Gerrit release in 2.15, we introduced to a new URL scheme, which includes the project name in the URL. Previously you had gerrit-review.googlesource.com/c/NNN and there was no way to directly know which project this is for and no way to do that load balancing that we just saw.

What we did in 2.15 is just add the project before that, so that extraction for both host and project can be made in a simpler way. You could do the same even before v2.15 but you needed a secondary index lookup, which most opensource load-balancers such as HAProxy or NGINX did not support. And of course, there are lots of products like Google Cloud load balancer, and others that you can use to achieve the same thing.

Wrap-up

We went through a journey where we took OpenSource Gerrit, we added sites selection and got a multi-tenant Gerrit.
Then we took this multi-tenant Gerrit, added replication and obtained multi-master Gerrit.
And then we took that with load balancing and lots of failures and lots of fixes, and we got pretty much the Gerrit that we run at Google, which brings me to the end of this talk 🙂

Q&A

Q: How strategic is Gerrit@Google? Do you have any other code-review systems? If yes, how is used Gerrit vs. the others?

We have another code-review system for internal use only, and Gerrit is used whenever we are doing OpenSource stuff, so for GoLang, Chromium, Android, Gerrit, and whenever the Google Team wants to collaborate with other OpenSource users, or in general with users that are not sitting at Google.

Historically the source at Google was developed in Perforce, and we ported from that to a home-based system called Piper. Around that, we have a tooling ecosystem which is internal. In parallel to that, Google started to do a lot of projects that have nothing to do with the internal search engine and available outside. What we see is that a lot of projects started at Google from scratch were thinking about “what system should we use?”. Many people said: “well, we’re going just to use Git because that’s what we know and we like, ” and when they needed code-review for Git they ended up with us. Gerrit and Git are very popular inside Google.

Q. You have two levels of load balancer. The first one is the location, and the second one is to decide what to do inside the data-center. What about if a location is off? Maybe is not fully off-line but has big problems, or has a very low-percentage of consensus, and some of the locations have not the “latest and greatest” of the repo. Possibly a location that should be “inconvenient for me” actually has the data I want.

You’re talking about replication layer where you have the objects in one location but not in the other. Our replication latency is in the order of seconds, but it may happen that one location is just really slow in getting the objects. That happens from time to time, and we have metrics that says what the replication lag is accounted for. When it exceeds a threshold we just shut the data-center off, which means cut-off the traffic, the data-center will not receive user-traffic anymore but it will still be able to get the replication done, and when the decrease the objects we need to replicate we can send the traffic again.

Cutting off the traffic is happing at the L1 load balancer where we said “don’t send anything there”.

Q. Do all the tasks have the same setup? Or do have a sort of micro-service architecture inside where some of the tasks are more dedicated to this type of operations and other for another type. Serving data from memory in one thing, but calculating diff change is a different type of task.

Not in general. All of our tasks are the same, except for checking access control permissions. We do not go through the whole Gerrit stack but we have only this little task that knows how the project config works and is going to tell us yes or no.


Gerrit Upgraded with No Downtime

Screen Shot 2016-03-21 at 20.48.12

Zero DownTime success story.

From today at 08:06 GMT GerritHub users are served by our brand new infrastructure geo-located in Canada, Quebec, Beauharnois. It is the first time we applied a zero-downtime roll-out scheme, the PingDom uptime for the past 24h reported 100% uptime and 688 msec average response time for the page of the list of opened changes. The two response times spike on the above graphs are actually due to the old German infrastructure and happened before the start of the roll-out.

We can see the switch of the traffic to the new infrastructure from the increase of the overall response time (IP packets were routed from Germany to Canada causing extra hops); as the DNS propagation was spreading across the world, the overall number of hops gradually came back to normal.

Timeline of the events.

  • 08:00:00 GMT – Phase 1 – Set Gerrit READ-ONLY. All changes and Git repositories started to refuse push and updates.
  • 08:00:01 GMT – Phase 2 – Wait for pending replication to complete. Replication queue was empty; there was no need to wait.
  • 08:00:02 GMT – Phase 3 – Mirror DB and Git for the last time, delta-reindex, DB upgrade and Gerrit restart. It has been the longest part of the roll-out and lasted 5′ 32”, aligned with our estimates.
  • 08:05:34 GMT – Phase 4 – Cache warm-up. 20K projects, 8K accounts and 4.6K groups were pre-loaded in Gerrit. This step was optional but allowed us to redirect all the traffic without risks of causing thread spikes on the new infrastructure.
  • 08:06:23 GMT – Phase 5 – Redirect traffic to the new infrastructure.

Did anybody notice the rollout?

During the rollout the Git projects and Gerrit changes were read-only for 6′ and 23”. According to the logs, 493 Git/HTTP and 172 Git/SSH invocations were made and completed successfully: none of them failed.

What is the situation right now?

The new infrastructure public IP (192.99.233.76) has almost completed his DNS propagation around the world, the only countries not entirely covered are Australia and China. The rest of the world is coming directly to Canada avoid the German hops. Metrics are good, low CPU utilization and threads consumption compared to the old German infrastructure, symptom of the reduction of the execution and serving times and latency.

What’s next?

From now on we will continue to use this Blue/Green roll-out strategy, possibly improving in the ReadOnly window by introducing live distributed reindex and cache warm-up.

We fully commit to Zero-Downtime and Stability, the most valuable assets for our clients.

Gerrit Code Review and Jenkins Continuous Delivery Pipeline on BigData

Gerrit at the Jenkins User Conference 2015 – London

For the very first time, CloudBees organised a full User Conference in London and we have been very pleased to speak to present a real-life case-study of Continuous Integration and Continuous Delivery applied to a large-scale BigData Project.

See below a summary of the overall presentation published on the above YouTube video.

The trap of the BigData production phase

BigData has been historically used by data scientists in order to analyse data and extract  features that are relevant for the business. This has typically been a very interactive process happing mostly on “notebook-style” environments where almost everything, from ad-hoc queries and graphs, could have been edited and executed interactively. This early stage of the process is typically known as “exploration” or “prototype analysis” phase. Sometimes last only a few days but often is used as day-by-day modus operandi.

However when the exploration phase is over, projects needed to be rewritten or adapted using a programming language (Scala, Python or Java) and transformations and aggregations expressed in jobs. During the “production-isation” phase code needs to be properly written and tested to be suitable for production.

Many projects fall into the trap of reducing the “production phase” to a mere translation of notebooks (or spreadsheets) into Scala, Java or Python code, relying only on the manual analysis of the resulting data as unique testing methodology. The lack of software engineering practices generates complex monolithic code,  difficult to maintain, to understand and thus to validate: the agility of the initial “exploration” phase was then miserably lost in the translation into production code.

Why Continuous Delivery on BigData?

We have approached the development of BigData projects in a radically different way: instead of simply relying on existing tools, often not enough for setting up a proper Agile Delivery Pipeline, we introduced brand-new frameworks and applied them to the building blocks of a Continuous Delivery pipeline.

This is how Stefano Galarraga wrote started the ScaldingUnit project, aimed in de-composing the development of complex Scalding MapReduce jobs in simple and testable units.

We started then to benefit from the improved Agility and speed of delivery, giving constant feedback to data-scientists and delivering constant value to the Business stakeholders during the production phase. The talk presented at the Jenkins User Conference 2015 is smaller-scale show-case of the pipeline we created for our large clients.

Continuous Delivery Pipeline Building Blocks

In order to build a robust continuous delivery pipeline, we do need a robust code-base to start with: seems a bit obvious but is often forgotten. The only way to create a stable code-base,  collectively developed and shared across different [distributed] Teams, is to adopt a robust code review lifecycle.

Gerrit Code Review is the most robust and scalable collaboration system that allows distributed teams to submit their changes and provide valuable feedback about the building blocks of the BigData solution. Data scientists can participate as well during the early stage of the production code development, giving suggestions and insight on the solution whilst is still in progress.

Docker provided the pipeline with the ability to define a set of “standard disposable systems” to host the real-life components of the target runtime, from Oracle to a BigData CDH Cluster.

Jenkins Continuous Integration is the glue that allowed coordinating all the different actors of the pipeline, activating the builds based on the stream events received from Gerrit Code Review and orchestrating the activation of the integration test environments on Docker.

Mesos and Marathon managed all the physical resources to allow a balanced allocation of all the Docker containers across the cluster. Everything has been managed through Mesos / Marathon, including the Gerrit and Jenkins services.

Pipeline flow – Pushing a new change to Gerrit Code Review

The BigData pipeline starts when a new piece of code is changed on the local development environment. Typically developers test local changes using the IDE and the Hadoop “local mode” which allows the local machine to “simulate” the behaviour of the runtime cluster.

The local mode testing is typically good enough for running unit-tests but often is unable to detect problems (e.g. non-serialisable objects, compression, performance) that are likely to appear in the target BigData cluster only. Allowing to push a code change to a target branch without having tested on a real cluster represent a potential risk of breaking the continuous delivery pipeline.

Gerrit Code Review allows the change to be committed and pushed to the Server repository and built on Jenkins Continuous Integration before the code is actually merged into the master branch (pre-commit validation).

Pipeline flow – Build and Unit-tests execution

Jenkins uses the Gerrit Trigger Plugin to fetch the code currently under review (which is not on master but on an open change) and triggers the standard Scala SBT build. This phase is typically very fast and takes only a few seconds to complete and provide the first validation feedback to Gerrit Code Review (Verified +1).

Until now we haven’t done anything special of different than a normal git-flow based continuous integration: we pushed our code and we got it validated in Jenkins before merging it to master. You could actually implement the pipeline until this point using GitHub Pull Requests or similar.

Pipeline flow – Integration test automation with a real BigData Cloudera CDH Cluster

Instead of considering the change “good enough” after a unit-test validation phase and then automatically merging it, we wanted to go through a further validation on a real cluster. We have completely automated the provisioning of a fully featured Cloudera CDH BigData cluster for running our change under review with the real Hadoop components.

In a typical pipeline, integration tests in a BigData Cluster are executed *after* the code is merged, mainly because of the intrinsic latencies associated to the provisioning of a proper reproducible integration environment. How then to speed-up the integration phase without necessarily blocking the development of new features?

We introduced Docker with Mesos / Marathon to have a much more flexible and intelligent management of the virtual resources: without having to virtualise the Hardware we were able to spawn new Docker instances in seconds instead of minutes ! Additionally the provisioning was coordinated by the Docker Build Step Jenkins plugin to allow the orchestration of the integration tests execution and the feedback on Gerrit Code Review.

Whenever an integration test phase succeeded or failed, Jenkins would have then submitted an “Integrated +1/-1” feedback to the original Gerrit Code Review change that triggered the test.

Pipeline flow – Change submission and release

When a change has received the Verified+1 (build + unit-tests successful) and Integrated+1 (integration-tests successful) is definitely ready to be reviewed and submitted to the master branch. The additional commit triggers the final release build that tags the code and uploads it to Nexus ready to be elected for production.

Pipeline flow – Rollout to production

The decision to rollout to production with a new change is typically enabled by a continuous delivery pipeline but manually operated by the Business stakeholders. Even though we could *potentially* rollout every change, we did not want *necessarily* do that because of the associated business implications.

Our approach was then to publish to Nexus all the potential *candidates* to production and roll-them-out to a pre-production environment, ready to be assessed by Data-Scientists and Business in real-time. The daily job scheduler had a configuration parameter that simply allowed to “pointing” to the version of the code to run every day. In this way whatever is deployed to Nexus is potentially fully working in production and rollout or rollback a release is just a matter of changing a label in the daily job scheduler.

Summary

Building a Continuous Delivery Pipeline for BigData has been a lot of fun and improved the agility of the Business in rolling out changes more quickly without having to compromise on features or stability.

When using a traditional Continuous Integration pipeline, the different stages (build + unit-test, integration-tests, system-tests, rollout) are all happening on the target branch causing it to be amber or red at times: whenever tests are failing the pipeline need to be restarted from start and people are blocked.

By adopting a Code Review-driven Continuous Integration Pipeline we managed to get the best of both worlds, avoiding feature branches but still keeping the ability to validate the code at each stage of the pipeline and reporting it back to the original change and the associated developer without to compromise the stability of the target branch or introducing artificial and distracting feature branches.

Resources

The slides of the talk are published on SlideShare.

All the docker images used during the presentation are available on GitHub: